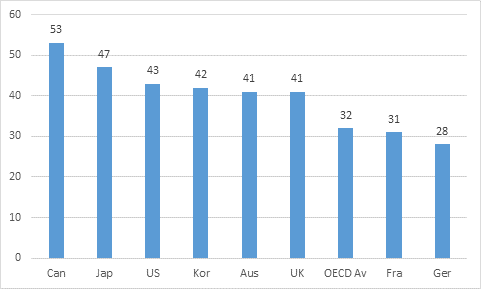
The OECD’s annual Education at a Glance publication was released on Tuesday. There weren’t a whole lot of shockers in there, but one thing that always sets Canadians crowing is the table that looks at tertiary educational attainment because, at first glance, we seem to do really well on that measure. To wit:
Figure 1: Tertiary Attainment Rates, 25-64 Year Olds, Canada, OECD Average and Select OECD Countries, 2012
Yay Canada! We’re number one!
Well, hang on a second. A lot of that is because we’ve been in the mass higher education game longer than anyone else: indeed our 55-64 year olds are in a class of their own. But when it comes to educating young people, it’s a different story. To wit:
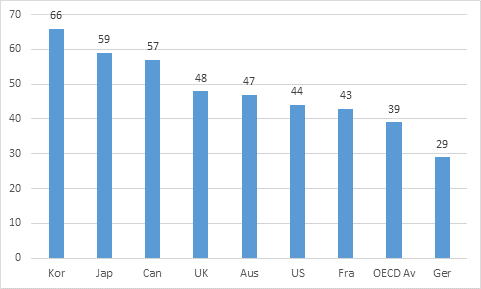
Figure 2: Tertiary Attainment Rates, 25-34 Year Olds, Canada, OECD Average and Select OECD Countries, 2012
Okay, still not bad. Our attainment rate is higher among young people than the general population (57% vs. 53%), which means we’re making some progress, albeit slow. And we’re still 18 points above the OECD average. But notice we’re third now, behind Korea and Japan.
Now let’s look specifically at degree-level attainment rates – or, what in international educational statistics-speak is known as “Tertiary Level 5A” – as opposed to tertiary rates.
Figure 3: Tertiary 5A Attainment Rates, 25-34 Year Olds, Canada, OECD Average and Select OECD Countries, 2012
See, now this is quite a different picture. If we’re simply looking at obtaining degrees, Canada is actually below the OECD average. We’d need to increase our degree attainment rates by almost 50% to be in first place here. The reason for this, of course, is that unlike most countries, Canada has a big “Tertiary B” sector, as shown below in Figure 4.
Figure 4: Tertiary 5B Attainment Rates, 25-34 Year Olds, Canada, OECD Average and Select OECD Countries, 2012
Interpreting the 5B data is a bit tricky, partly because Tertiary B data looks very different depending on the country, but also partly because the Canadian data is a mess. In some countries, Tertiary B is purely vocational; in others (for instance, Korean and the US) the figures include junior college associate degrees, which in other countries would be considered incomplete 5A degrees.
In Canada, the Tertiary B figure is mostly traditional community college/polytechnic completers below degree level. But it also includes a number of other types that make it not entirely comparable to other countries, including:
- CEGEP Graduates who Never Went on to Universities. Few other countries would consider people with only 13 years of schooling to be Tertiary B;
- Trade/Apprenticeship Certificate Holders. In Europe, where apprenticeship systems are considered part of the secondary system, these kinds of programs would be considered level 4 or even level 3;
- Private Vocational College Credential Holders. Again, these are usually one year or less in duration, and it’s unlikely most countries would consider them equivalent to Tertiary B.
Now, there’s nothing sinister here – these differences aren’t an attempt to “juice” our numbers. The first two issues are the result of structural differences – part and parcel of the difficulties of trying to standardize data internationally across not-entirely-parallel systems. The third one – private vocational credentials – is an outgrowth of the fact that this data is taken from various Labour Force Surveys, and the wording of the relevant question on our survey is just a little looser than in other countries.
All of this is to say that a “Canada’s Number One” narrative based on the OECD numbers isn’t necessarily warranted. In some ways, we may even be falling behind.


 Tweet this post

Hi Alex,
When you talk about CEGEP graduates who never went to university, you should have made it clear that you are talking about graduates who enrolled in the university stream. Most vocational programs in CEGEPs are 3-year programs, so graduates from those programs would have 14 years of schooling, not 13. I don’t know whether this is enough to qualify for Tertiary B.
Also, I just wrote up a summary of The Many Prices of Knowledge for our new in-house bulletin, Tendances. I thought that was a very ingenious way of illustrating how student assistance and tax credit measures interact to create very different outcomes for different types of students in each province. I’ll send you a copy when it is out. best regards. Best regards.
Jocelyn
Hi Jocelyn. Thanks for this. Hope you are well.
Yes, fair point re: Cegep grads. My bad. Glad you liked the “Many Prices” piece. Do send along the summary.
Alex, in the light of the OECD data can you make any sense out of the World Economic Forum’s Global Competitiveness Report where Canada is ranked 45th for tertiary enrolment? Their “higher education and training” dimension (5) is one of the categories which dragged down our overall rating. While most of the numbers are surveys of national execs and therefore subject to all kinds of bias, the enrolment data (Table 5.02 on p. 457) is supposedly drawn from UNESCO which I believe uses sources like the OECD tables.
I can’t figure out where WEF got the numbers they are using: Canada looks realistic at a 57% rate for the typical first degree population, but the U.S. at 94%? Greece at 114%? Some of the weirdness no doubt comes from the presence of older students who are counted in the numerator but not in the denominator, but still this doesn’t come close to passing the sniff test. It’s bad enough that the media reports treat the WEF report as somehow authoritative – and politicians feel compelled to respond – without any sense of how suspect the survey mechanisms are. If the minority of their ratings that actually come from hard data are also suspect, then we should just be ignoring the Global Competitiveness Report altogether.
[I pointed out this out to Doug Watt at the Conference Board, who run the Canadian exec survey for the GCR, but their press release does nothing to raise issues about the data and the way it is interpreted, http://www.conferenceboard.ca/topics/education/commentaries/14-09-03/canada_s_competitiveness_performance_billowing_in_the_winds_of_change.aspx%5D
Tom
Hi Tom. WEF measures Tertiary 5A, not Tertiary. University only, basically. Greek numbers are really high because they measure enrolments rather than actual students. Lots of people there enroll for years without going to classes because they get concessionary fares for transport, etc.
That explains the number from Greece, but how does the U.S. get to 94%? Surely the students in certificate and diploma programs in 2-year colleges can’t count as 5A?
They do indeed. They’re all *potentially* transfers to universities, right?
OK, so the numbers really are a joke. I have been working with the two-year colleges in California, and in the LA region alone we have a head count of 25K “enrollees” who have completed 60 credits in community colleges but have not qualified for the two year Associate degree (let alone transfer on to a four-year institution). In 90% of those cases, it is the math requirement which is the stumbling block.
I’ll stop my comments here and just write off the World Economic Forum as a hopeless case.
Tom