Last week, I blogged about how OECD figures showed Canada had the highest level of PSE spending in the world, at 2.8% of GDP. Many of you wrote to me asking: i) if the picture was the same when we looked at other measures, like per-capita spending or spending per-student; and, ii) could I break things down by province, instead of nationally. I am ever your servant, so I tried working on this.
I quickly came up against a problem, which was simply that I could in no way replicate the OECD numbers. Using numbers from FIUC (for universities) and FINCOL (for colleges), the biggest expenditure number I could come up with for the 2011-12 year was $41.75 billion in institutional income. Dividing this by the 2011 GDP figure of $1.72 billion used in Education at a Glance (itself inexplicably about 3% smaller than the $1.77 billion figure Statscan reports for 2011) gives me 2.43%, rather than the 2.8% Statscan reported to OECD. There is presumably an explanation for this (my best guess is that it has something to with student assistance), and I have emailed some folks over there to see what’s going on. But in the meantime, we can still have some fun with inter-provincial comparisons.
Let’s start with what provinces spend on universities:
Figure 1: University Income by Province and Source as a Percentage of GDP
In most provinces, total university expenditure is right around two percent of GDP. Only in two provinces (Saskatchewan, Alberta) is it significantly below this, and only in two (Nova Scotia, Prince Edwards Island) is it significantly above. In terms of public expenditure, the average across the country is about one percent of GDP. Nova Scotia, at 3.2%, is likely by some distance the highest-spending jurisdiction in the entire world.
Now, some of you are no doubt wondering: how the heck can Nova Scotia universities spend two and a half times what Alberta universities spend (in GDP terms) when the latter are so bright and shiny and the former are increasingly looking a little battered? Well, I’ll get more into this tomorrow, but the quick answer is: Alberta’s GDP is eight times higher than Nova Scotia’s, but it only has about three times as many students.
Of course, universities aren’t the whole story. Let’s look at colleges:
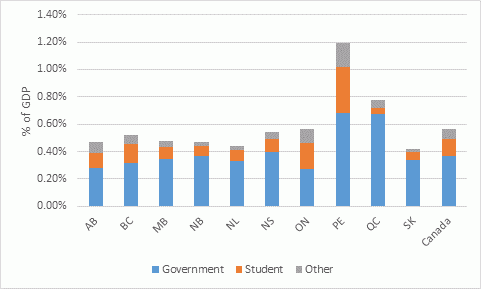
Figure 2: College Income by Province and Source as a Percentage of GDP
This is a wee bit more interesting. Most provinces are bunched closely around the 0.5% of GDP mark, except for Quebec and Prince Edward Island. If we were using international standards here, where college is usually interpreted as being ISCED level 5 (or level 5B before the 2011 revision), Quebec’s figures would be much lower because CEGEP programs leading to university are considered level 4 (that is, post-secondary, but not actually tertiary), and hence would be excluded.
But PEI is the real stunner here: apparently Holland College accounts for nearly 1.2% of GDP. This sounds ludicrous to me and I have no explanation for it, but having looked up Holland College’s financials it seems to check out.
Here’s the combined picture:
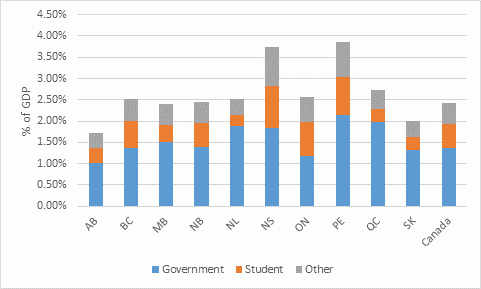
Figure 3: Total PSE Income by Province and Source as a Percentage of GDP
So, what we see here is that most provinces again cluster around spending 2.5% of GDP, which would put their spending roughly on par with the world’s second-biggest spender, Korea (but slightly behind the United States). Saskatchewan, at 2% of GDP, would still be ranked very highly, while Alberta, at 1.73% would be only a bit above the OECD average.
The crazy stuff is at the other end: PEI and Nova Scotia, where higher education spending exceeds 3.75% of GDP. And yeah, their GDP is lower than most of the rest of the country (GDP/capita in those two provinces, at $39,800 and $41,500, respectively, is less than half what it is in Alberta), but there are lots of OECD countries with GDPs of roughly that level of income (e.g. Spain) who spend about a third as much on education.
Tomorrow, we’ll look a bit more at per-student spending.


 Tweet this post

A good bit of the PEI difference is due to significantly higher transfer income which increases our fiscal capacity relative to GDP. Try comparing spending to revenue.