


Interesting question. It’s a tricky answer. Let’s dive in.
Let’s start by looking at the issue of unemployment – that is, the percentage of people who are in the labour market but do not have work (i.e. it excludes people who aren’t interested). Figure 1 shows unemployment rates for full-time students and non-students aged 20-24 for the past fifty years (I exclude part-time students because they are an odd and heterogenous grouping).
Figure 1: Unemployment Rates during School Months for 20-24 year-olds, Full-Time Students and Non-Students, Canada, 1976-2025
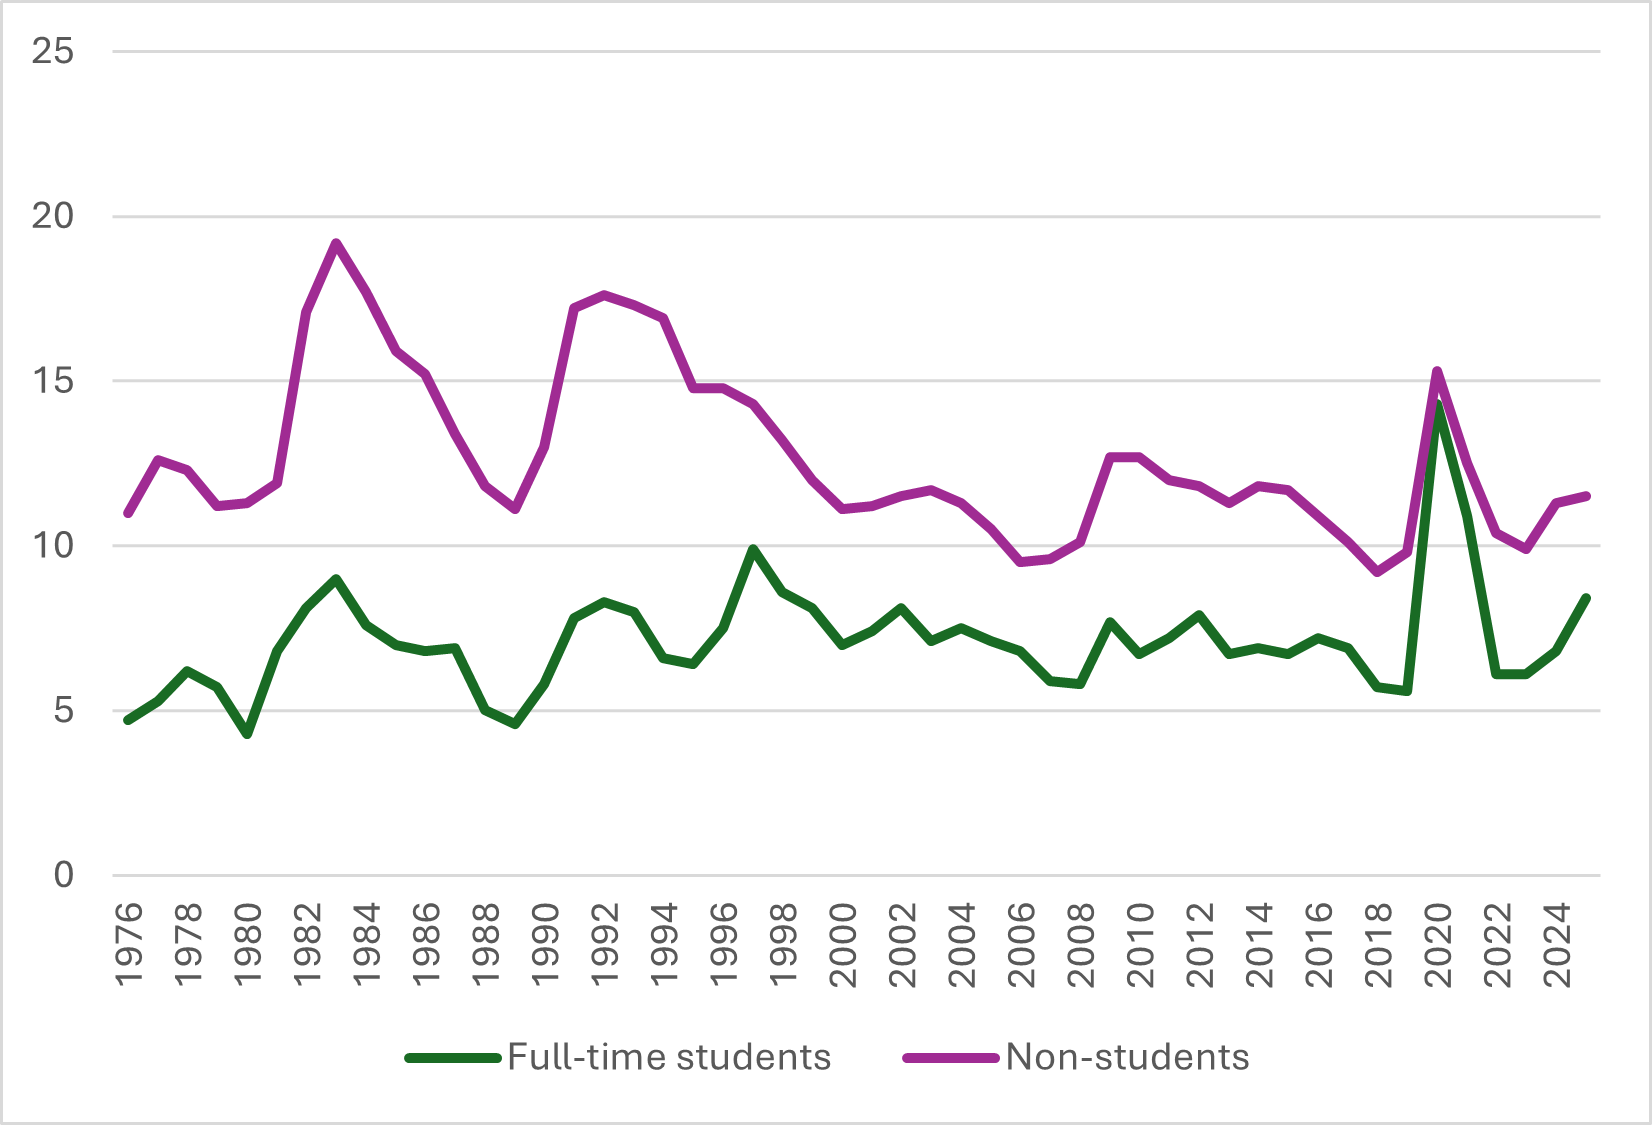
So, the first thing to notice about this graph is this: for full-time students, COVID apart, the average unemployment rate of 8.4% was higher than at any time since 1998. In fact, 2025 was the fourth-worst year on record for full-time students. That’s a big deal.
But it’s not quite the whole story, for a couple of reasons. First, let’s look at what’s been going on with unemployment among non-students. Unemployment for this group was higher, at 11.5%, but from a historical perspective it actually wasn’t that bad. That was about average for this group from 2008 to 2016, and actually slightly below the 50-year average as a whole.
Quite plainly, the relationship between the unemployment rates of students and non-students has changed quite bit in the last fifty years. Up until 1995, unemployment rates of non-students were twice as high as those of full-time students. Since then, the gap has dropped to about 55-60%. And in 2025, the gap between the two rates is lower than it has ever been.
Now, there are a couple of things going on here. The first is that the proportion of 20-24 year-olds who are full-time students is much higher now than it was fifty years ago. Fifty years ago, full-time students were a much smaller and more elite bunch. But that is only one dimension of the change that has been going on: as figure 2 shows there has also been a huge change in labour market participation rates as well.
Figure 2: Participation Rates during School Months for 20-24 year-olds, Full-Time Students and Non-Students, Canada, 1976-2025
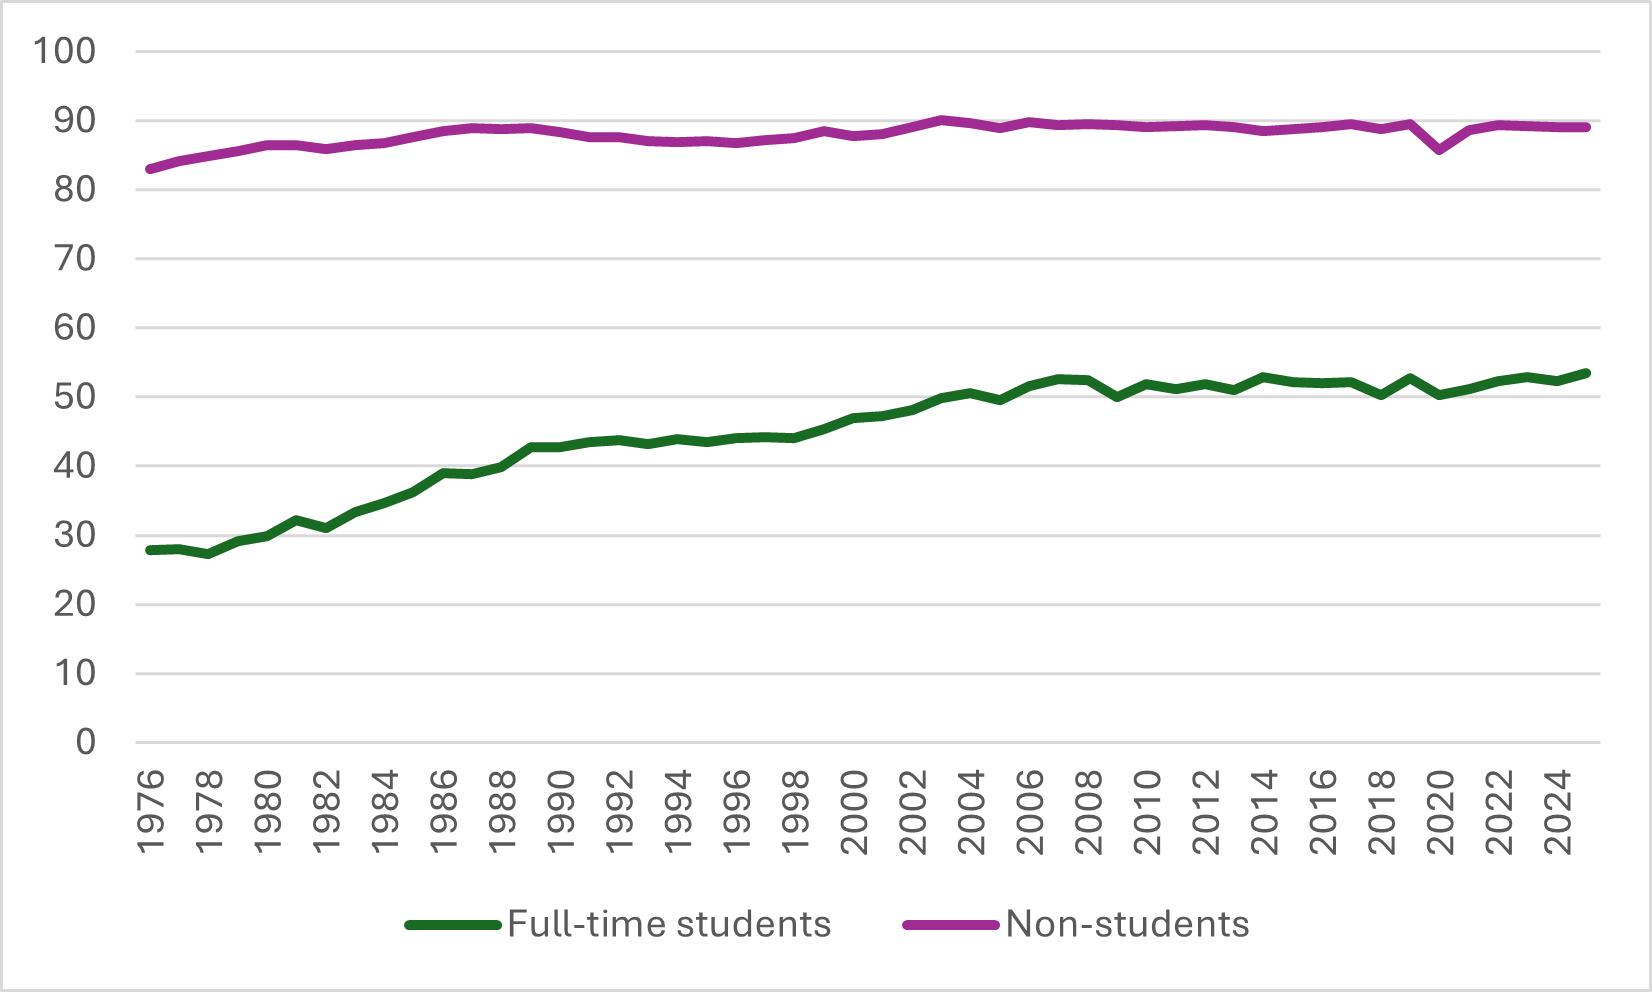
Over the course of the late 20th century, student labour market participation rates jumped from just under 30% to just over 50%. So, not only has there been a big jump in the proportion of the youth population who are students, the proportion of the youth labour market which is made up of students has grown even faster. Given that, you’d kind of expect the rates to converge a bit.
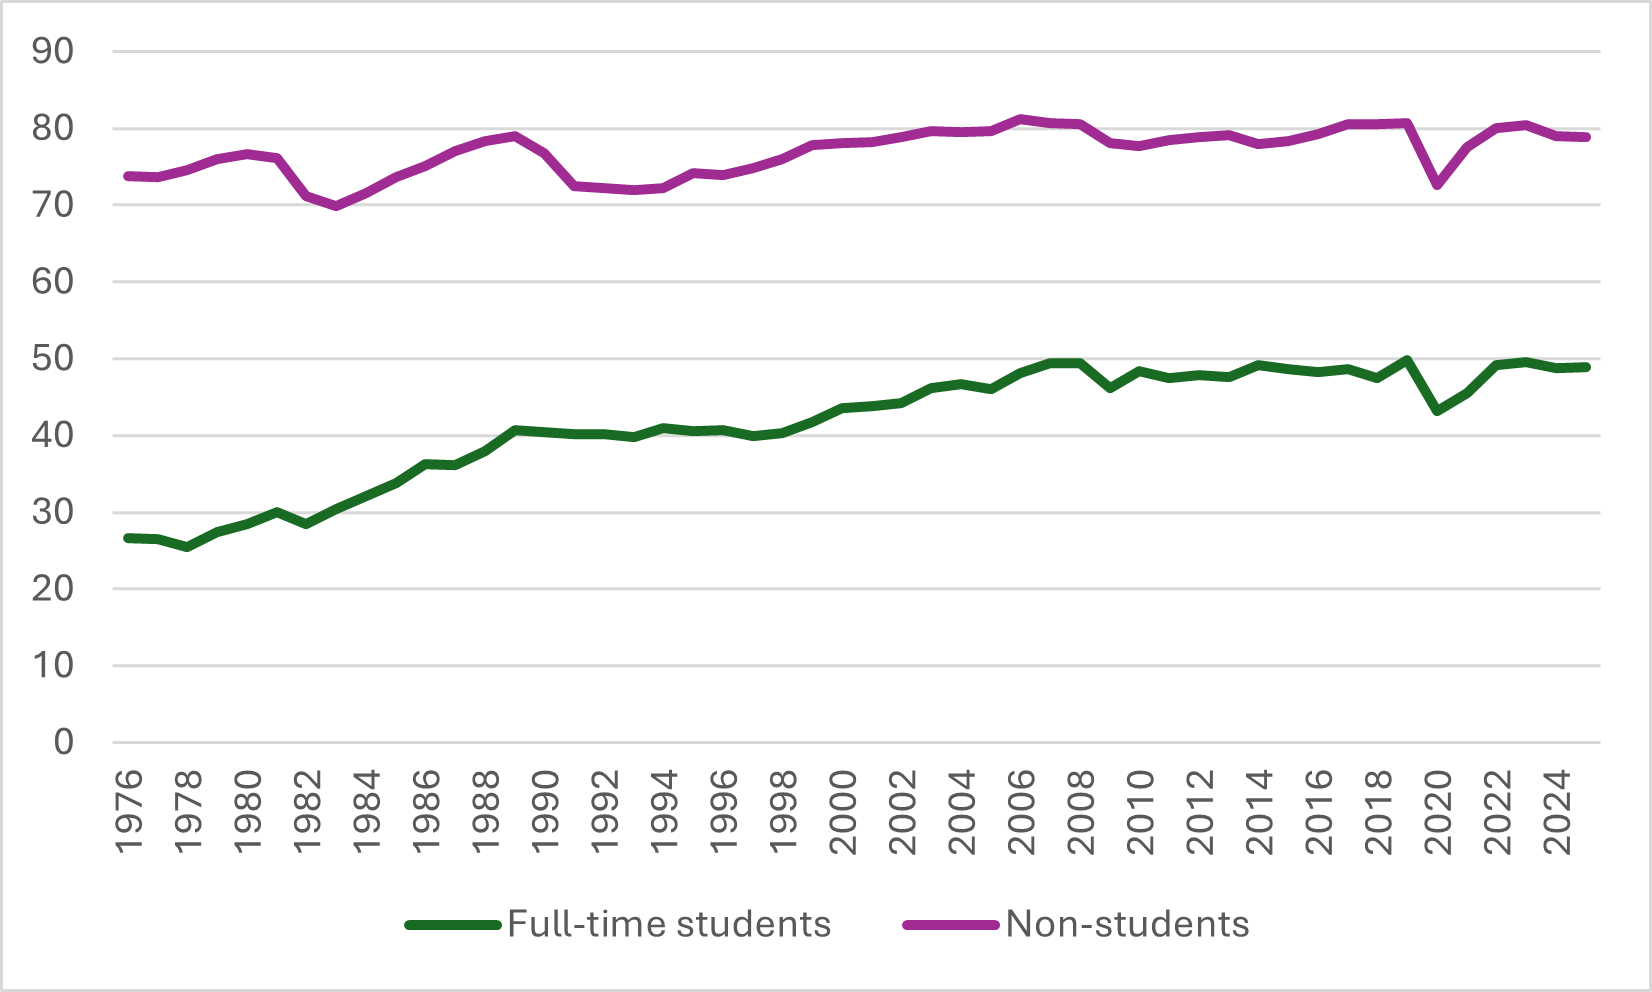
Now, take a look at figure 3, which shows employment rates; that is, the percentage of the total population that is working. You’d think this would be the inverse of figure 1, but it’s not. Even though figure 1 shows that full-time student unemployment is near an all-time high, it turns out that the rate of full-time student employment (48.9%) is within a hair’s breadth of also being at an all-time high, too (49.8%, in 2019). Both are true and both are related – it’s all down to a rising participation rate.
Figure 3: Employment Rates during school months for 20-24 year-olds, Full-Time Students and Non-Students, Canada, 1976-2025
One final point to be made here. It’s clear that the convergence between student and non-student unemployment rates shown in figure 1 is partly due to rising enrollment and participation rates. But another hypothesis consistent with this data is that the gap between how the market values student and non-student skill levels is dropping. This might be happening for a few reasons. One is that actual skill gaps are decreasing, which could easily be true since a greater percentage of non-students were high-school completers. But the other reason might be that the value of the first couple of years of postsecondary education are decreasing. That need not be a sign that the return to skills generally is decreasing – in fact, it might be quite the opposite. It might be that the threshold level of skills required to start seeing a premium in the labour market have increased.
Anyways, TL;DR: it’s complicated. It’s not a good news story, but it’s not as bad as it looks at first glance, and a lot of the factors at play seem to be very long-term in nature, as opposed to short-term one like increasing AI adoption or current economic weakness, or what have you.


2 Responses
How do you factor in the number of students who choose NOT to work? We are seeing from student surveys and hearing anecdotally that many students, especially townies living at home, don’t work part-time during the academic year or the summer. Between scholarships and parents’ support they apparently don’t need to work, and many refuse to take a job that “only” pays minimum wage. Is growing family affluence, e.g., RESPs and TFSAs, negating the need for many students to work?
Thanks, Alex- Appreciate this. Did you see any gender differences?