Canada usually alternates between good news and bad news when it comes to higher education data. Good news: we’re getting marginally better data on profs, for only $1 million per year. Bad news: we have literally no data on students beyond registration data anymore (social/economic background, anyone?), and no one seems to care.
But away from Statscan, we are starting to see a new culture around data which I think is quite heartening: institutions choosing to be more transparent about data. We saw this in Ontario early last month when COU published its data on faculty workloads. Now U of T has done it a new study on the destinations of doctoral graduates called the 10,000 PhDs Project (Globe and Mail story here).
I really love what U of T has done here. Without a whole lot of editorializing, they use interactive data (go play with it here) to create a series of stories of increasing complexity. There’s simple stuff, like raw numbers (rising from 500/year in 2000 to 900/year in 2015), gender (since 2012 females outnumber males among PhDs awarded), citizenship (proportion of graduates who were international students grew a bit from 10% to 15%), and field of study (humanities barely increased, while physical and life sciences increased by a factor of 2.5).
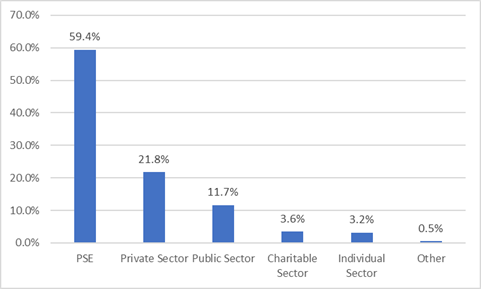
The big news – the stuff everyone in the higher ed industry hopes you remember – is this next graph, which shows that 60% of PhD graduates from the last fifteen years are in “post-secondary education”. And this figure is more or less the same across all cohorts – the figure is 62% among those who graduated between 2000 and 2003, and falls only slightly to 58% among those graduated since 2012.
Figure 1: University of Toronto Doctoral Graduates 2000-2015 Employment Destinations
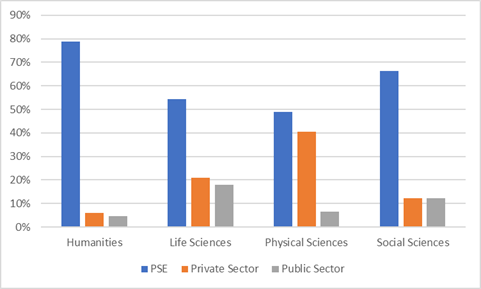
The bigger variation in destinations, frankly, comes by field of study. Nearly all humanities PhD graduates ends up in PSE one way or the other: fewer than half of physical science doctorates do. Life Sciences graduates are the likeliest to end up in the public sector, and Physical Science graduates are the ones likeliest to end up in the private sector.
Figure 2: University of Toronto Doctoral Graduates 2000-2015 Employment Destinations by Field of Study
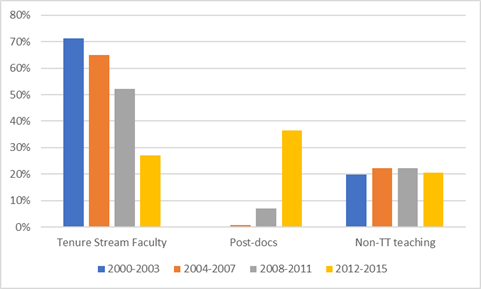
Now, you may think that “working in PSE” is just a clever euphemism to lump together people working as sessionals, people who have gone into low-level academic administration, and those who are in tenure-track jobs. Good thinking! That’s valid skepticism in an exercise like this. But in this case, it mostly turns out not to be true. Across all graduates who are employed in the PSE sector, over half are in university tenure-stream jobs, another 9% or so are research associates or working in professional schools. About 22% are teaching in college, teaching as sessionals/adjuncts or are “teaching stream” faculty. However, the split varies significantly by cohort, with older graduates being more likely to hold tenure-stream jobs.
Figure 3: University of Toronto Doctoral Graduates 2000-2015, Job Classification by Cohort, Graduates in PSE Sector only
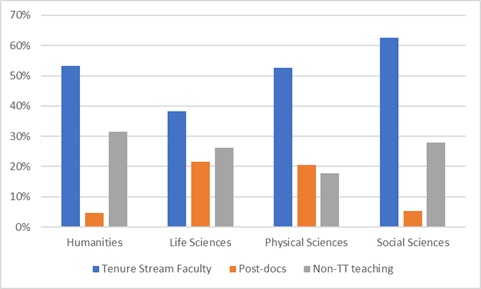
There are also some significant gaps by field of study: grads from social sciences and humanities are far more likely to end up in tenure-track jobs than those in the sciences.
Figure 4: University of Toronto Doctoral Graduates 2000-2015, Job Classification by Field of Study, Graduates in PSE Sector only
Now this all paints an interesting picture, but I think it’s important to add one massive caveat, namely: this is the University of Toronto only. Sure, it’s probably 15-20% of all PhDs in the country in any given year, but it’s still an outlier because it supplies so many faculty to other universities across the country. With the possible exceptions of UBC and McGill, most universities’ results are not going to look anything like this – more likely you will see much smaller proportions going into teaching and larger proportions going into public and private sectors.
Which is a pretty good reason to repeat this exercise at other institutions, I think. And U of T has show everybody how feasible such a project is. Kudos to them. And to everyone else: what are you waiting for?


 Tweet this post

Other Canadian PhD Outcome Studies
2015 McGill
http://www.mcgill.ca/gps/files/gps/channels/attach/mcgill_graduate_outcomes_survey_report_2015.pdf
2016 Higher Education Quality Council of Ontario
http://www.heqco.ca/SiteCollectionDocuments/Ontario's-PhD-Graduates-from-2009-ENG.pdf
2016 TRaCE (Humanities graduates from 24 universities)
http://iplaitrace.com/wp-content/uploads/2017/01/Stage1_SUMMARY_final.pdf
2017 UBC
http://outcomes.grad.ubc.ca/
http://outcomes.grad.ubc.ca/docs/UBC_PhD_Career_Outcomes_April2017.pdf