Yesterday we looked at different models of indigenous PSE around the world. Today, we’re going to look at some differences in levels of indigenous PSE access.
When we want to compare countries’ rates of access, we usually look at participation rates; that is, the percentage of people in a particular age group (usually 18-21) who attend PSE. But that doesn’t work well with indigenous students, who tend not to delay attendance until long after this “traditional” age.
There is a way to deal with this. When UNESCO wants to measure access, it looks not at participation rates but at the Gross Enrolment Ratios (GER), which divide the total number of students by the number of people in a particular age group. This is less useful than a real participation rate, but it’s a reasonable fix when standardizing statistics across countries when some national statistical systems are incapable of reporting real participation rates.
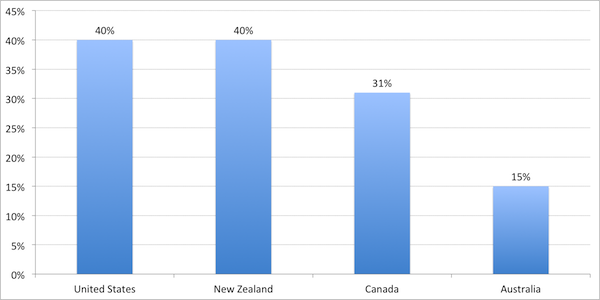
Since we have both total indigenous enrolments and age-divided population totals for Canada, the U.S., Australia and New Zealand, we can derive indigenous GERs for comparison. Figure 1 shows GERs at the university level:
Figure 1 – Indigenous Gross Enrolment Ratios in University-Level Education, 2009
The totals for the Commonwealth countries are about what you’d expect given the material conditions of indigenous peoples in each country, but it’s the American result which really catches the eye.
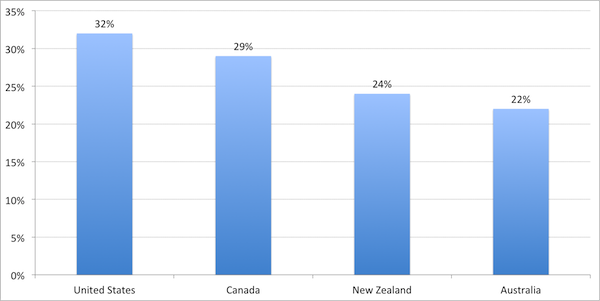
We can also try to make comparisons of non-university post-secondary across the four countries, though it’s a bit more difficult because the systems are so different. The numbers in the chart below represent community college enrolment in Canada, two-year college enrolment in the U.S., diploma-level enrolments in New Zealand and full-year equivalent TAFE enrolments in diplomas and certificate levels III & IV (wonkiness in the Australian data required me to do a bit of imputation, so take it with a larger-than-usual grain of salt). As Figure 2 shows, it’s once again the United States at the forefront and Australia at the back of the pack, with Canada slightly ahead of New Zealand this time.
Figure 2 – Indigenous Gross Enrolment Ratios in College-Level Education, 2009
There are a whole bunch of caveats here of course, not least of which is the differences in the various systems of vocational education and the lens chosen for comparison. If we included programs of less than one year in length, for instance, New Zealand’s college GER would be substantially in excess of 100%. So be cautious in concluding too much from these fairly rough comparisons.
But one thing we might tentatively conclude is that despite the tendency in Aboriginal education circles to glorify Maori achievements in post-secondary education, it’s the Americans who seem to have the best results. Maybe it’s time we paid a lot more attention to those Tribal Colleges to the South. It looks as if they might be on to something.


 Tweet this post

One response to “Comparisons in International Indigenous Education”