


It’s application season. Time used to be, I could give y’all some really good insight into application trends by using data from the Ontario University Application Centre as I did here, in 2018. And here, in 2021. All thanks to a modicum of data transparency
Until three years ago, OUAC was pretty good about providing data on applicants. It would tell you about applicant numbers, it would tell you about first-choice applications, and it would tell you about total applications. It could tell you the data by institution and by field of study (though it would occasionally muck around with the field categories). It could divide the data by applicants coming direct from Ontario secondary schools, and those coming through other processes (students who have taken a gap year, students from outside Ontario, etc). And then, three years ago, it just chucked all the data about first-choice applications.
And then the Ontario University Application Centre decided three years ago that it didn’t want to be transparent. Too difficult. Caused too many questions, which annoyed the comms staff at too many universities. So OUAC’s Board voted to become less transparent. Because the public’s right to data definitely comes second to the comfort of university comms staff.
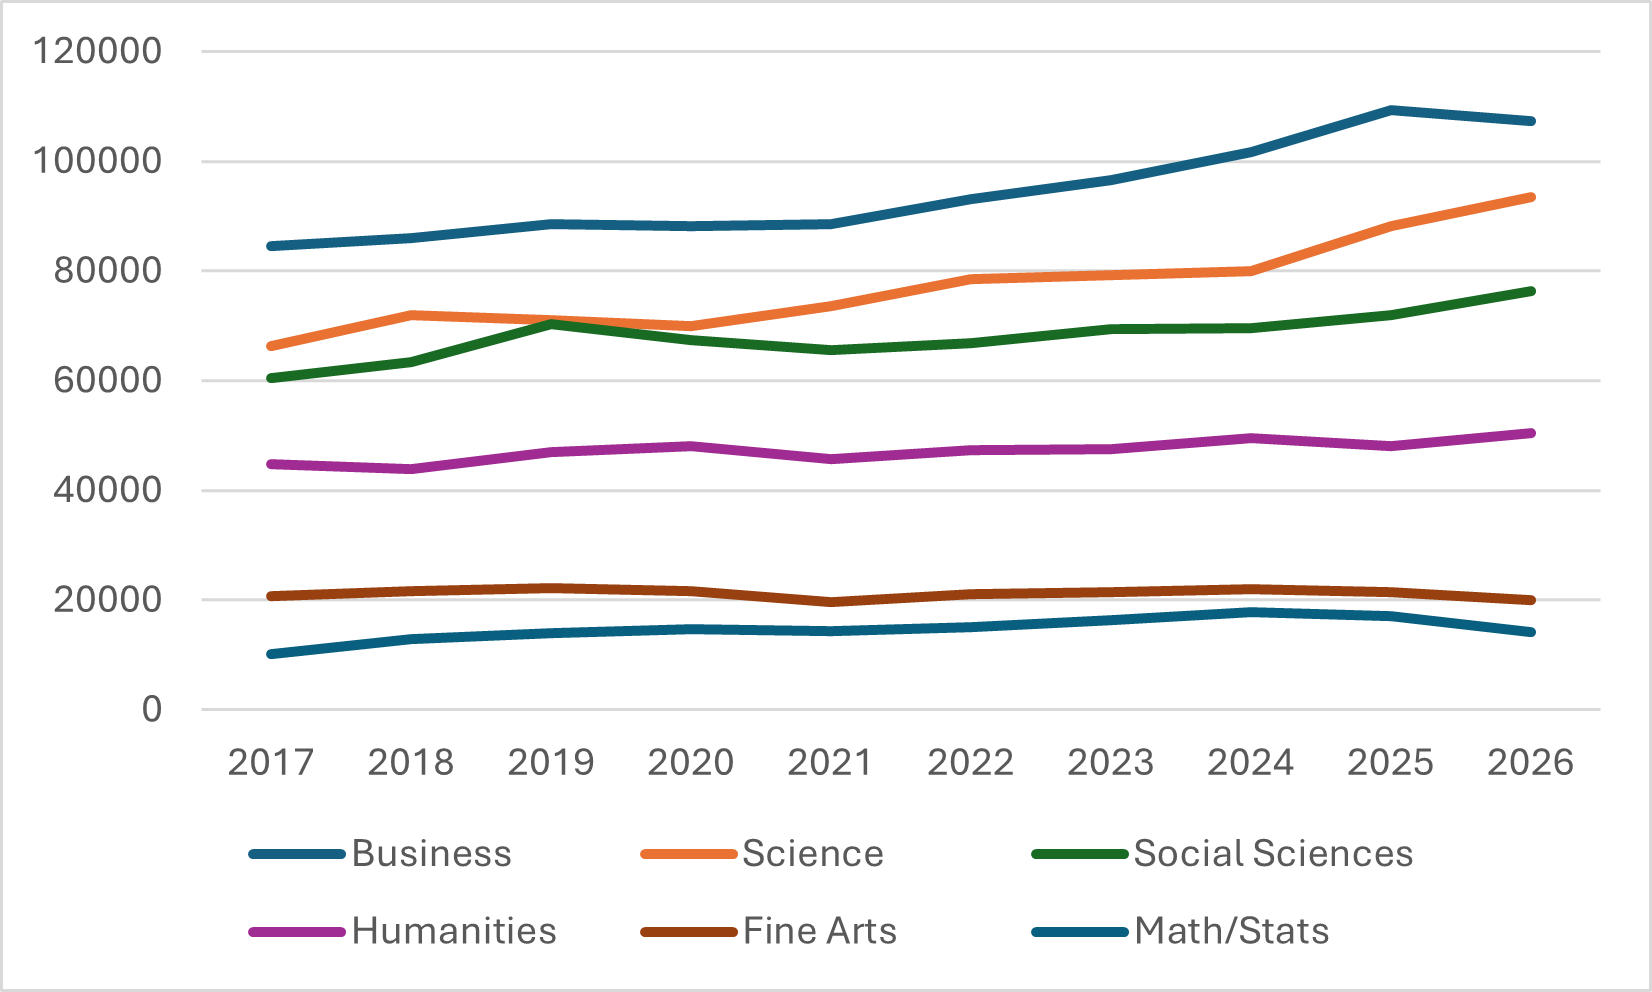
I’m now going to show you what data is currently published and then explain why it’s largely worthless. I’ll take two graphs to do it because there’s a lot of data. Figure 1 shows applications by field for fields where demand appears to have stayed reasonably consistent for the last decade.
Figure 1: Applications From Secondary School Leavers in Fields with Roughly Steady Enrolments, Ontario, 2017-2026
And in figure 2, I show applications by field for those fields where there appear to have been big changes in demand in the past few years. Key take aways: huge jumps in applications for Psychology (+94%) Health (+88%), Engineering (+79%), and a huge drop in computer/info tech applications (-46%) since 2023 after a doubling between 2017 and 2023.
Figure 2: Applications From Secondary School Leavers in Fields with Large Changes in Enrolments, Ontario, 2017-2026
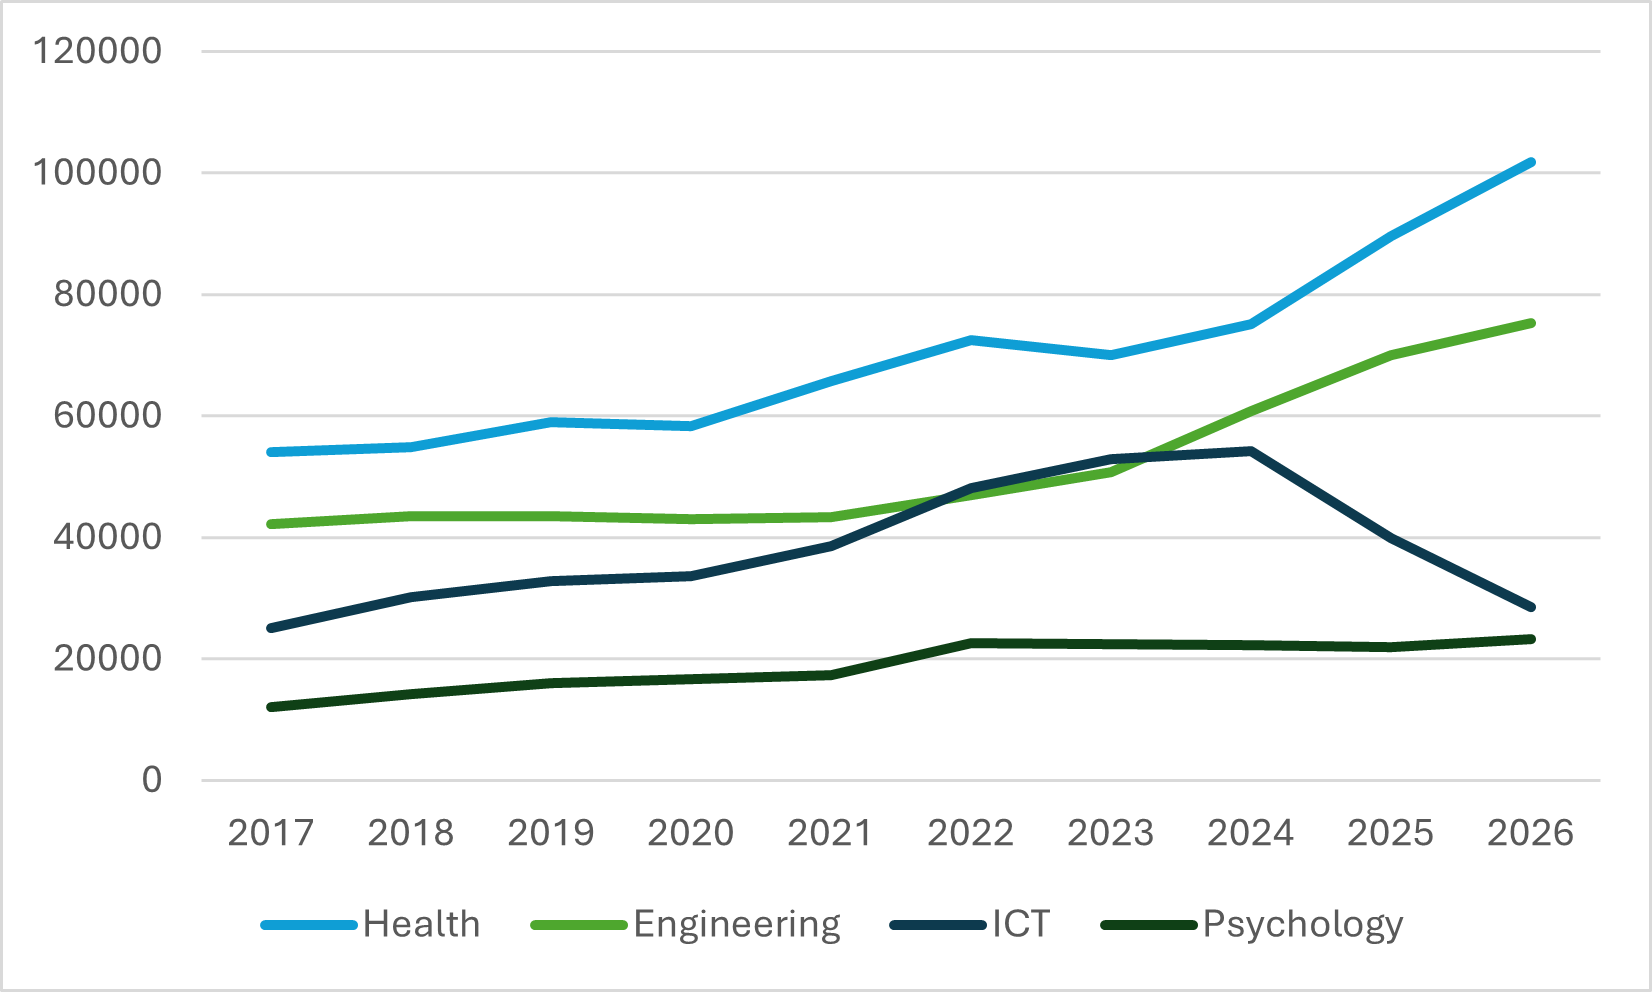
(Quick aside here about the challenges of Canadian universities’ economic model. Any university President looking at figure 2 in 2023 would be pilloried if they were not frantically offering tenure-track positions to computer scientists. After all: look at the huge increase in demand! Failure to hire means high student-faculty ratios! Equally, though, any university President who gave a bunch of computer scientists tenure-track positions in 2023 would look like an idiot in 2026. It’s extremely hard to react to changing demand when your only tool is lifetime employment offers).
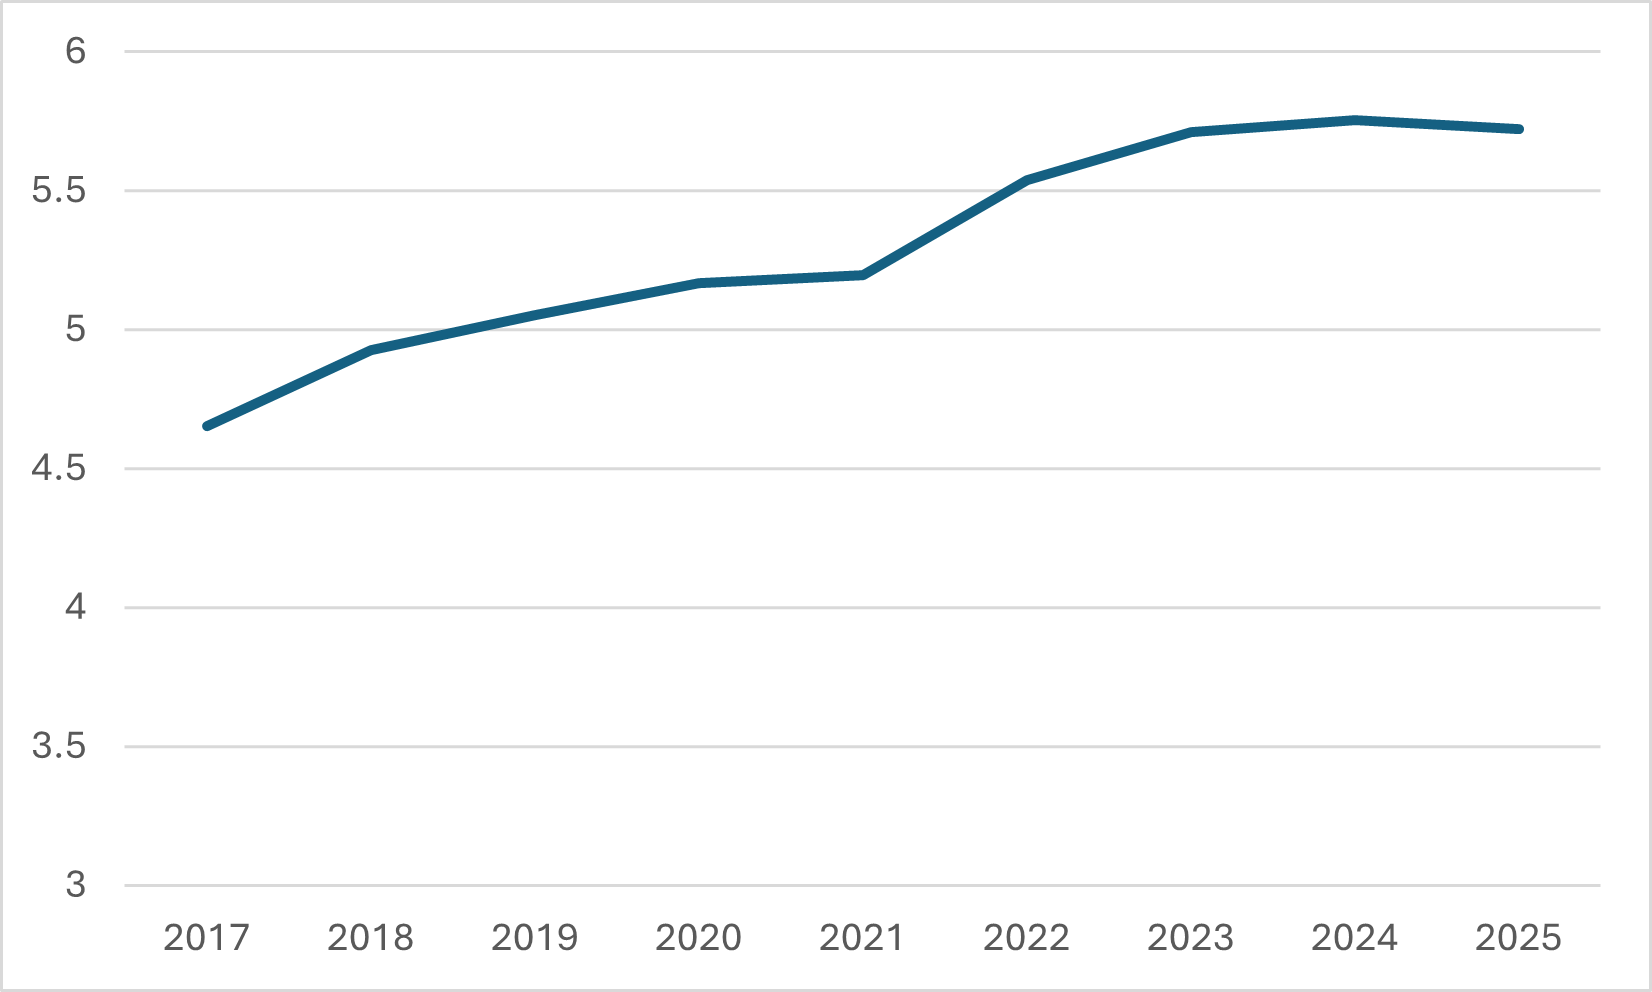
Anyways, you may be wondering why I keep using the term “applications” rather than “applicants”. And the reason is that OUAC refuses to release applicant numbers – and more specifically applicants who list a given field as a “first choice” – by field. They used to, but now they don’t. Now, if the relationship between applicants and applications were steady both over time and across fields of study this wouldn’t matter – it would be easy enough just to divide the data in figures 1 and 2 by the average number of applications of students and be done with it. But as figure 3 shows, this relationship is anything but stable over time; the number of applications per applicant has risen by 23% in less than a decade. And we have zero idea if it is stable across fields of study (and logic suggests it is probably not – when a certain of field gets “in demand” and spots hard to find, it stands to reason that students desirous of a spot would try to increase their chances by applying to more schools).
Figure 3: Applications per Applicant, Secondary School Leavers, Ontario, 2017-2026
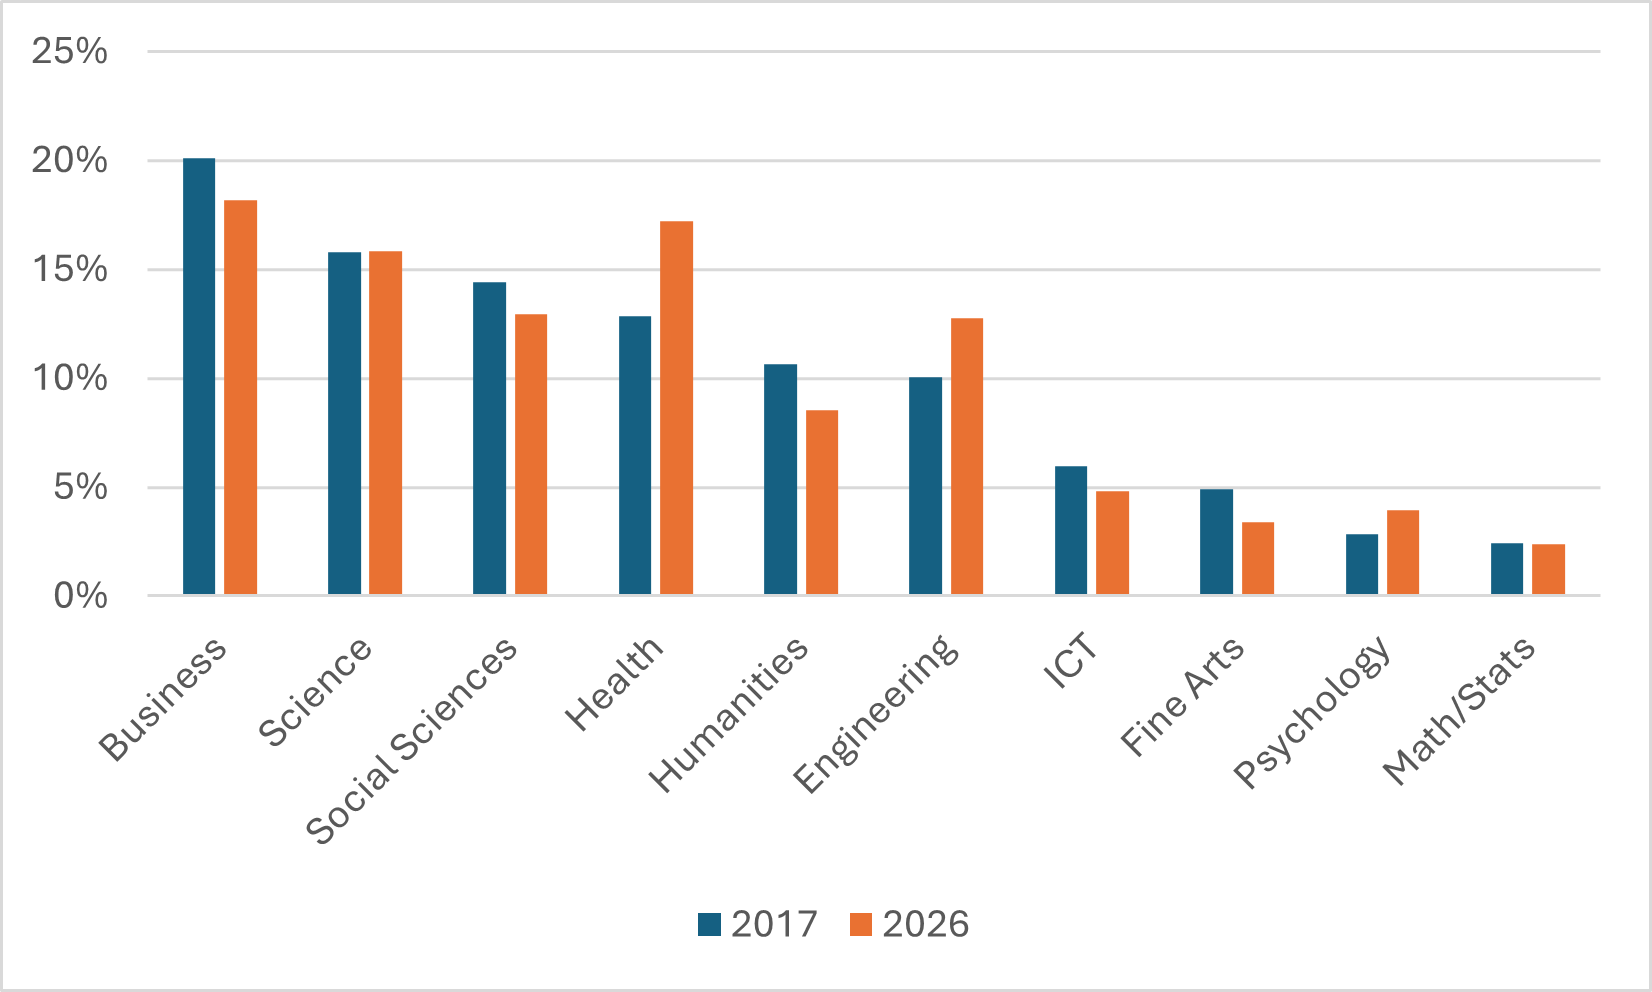
So, the best we can do, really, is look at changes in the proportion of total applications. And here, as we see in figure 4, the results are a bit non-intuitive. Compared to 2017, applications to programs in Business, Social Sciences, Humanities, Fine Arts and – crucially – Computer Science programs are all down. Applications to Health, Engineering and Psychology are all up. Science, and Math/Statistics are basically unchanged.
Figure 4: Share of total applications by Field of Study, Secondary School Leavers, Ontario, 2017 vs. 2026
I wish I could give you more data here, but I can’t, because Ontario universities, and the data centre they collectively own, in a word, suck. They are the problem. The fact that they would even entertain the idea that protecting comms staff from a couple of problematic inquiries is more important than data transparency is pretty appalling. And yet here we are.
Do better.