

It’s the first week of May, and at HESA Towers that means it’s provincial budget analysis time. As of now, nine of ten provinces have submitted budgets. Sure, PEI is missing, and Alberta is presumably going to have to re-do its budget once the election’s over, but neither of them is likely to have a budget before June, so now’s as good a time as any.
(Islanders feeling slighted may rest assured they are not being singled out. Our policy is to ignore anyone who can’t get a budget passed by May. Last year we ignored Quebec.)
Some standard but important caveats on this data: What we’re comparing here is announced spending in provincial budgets from year-to-year. But what gets allocated and what gets spent are two different things; Quebec in particular has a habit of delivering mid-year cuts to institutions, and student aid budgets can change rapidly if there is a shift in demand and/or interest rates.
On top of this, governments do not report expenditures consistently. In some cases (i.e. Quebec, the three maritime provinces), provinces make it difficult to differentiate between operating and capital expenditure; in other cases (Ontario, for example), we don’t have consistent data for operating and capital estimates, and so we can only report on operating budgets. That’s not a huge deal because what we are trying to do here is not compare absolute values of transfers across provinces, but rather look at relative change in each province over time, but it is still something to keep in mind.
Finally, changes in total transfers may be different from changes in formula funding: as governments continue to micromanage institutions, an increasing portion of total funding is being disbursed in what to institutions seems a fairly capricious (or at least unpredictable and unguaranteed) manner. Changes in institutional funding may therefore differ from the published provincial funding amounts.
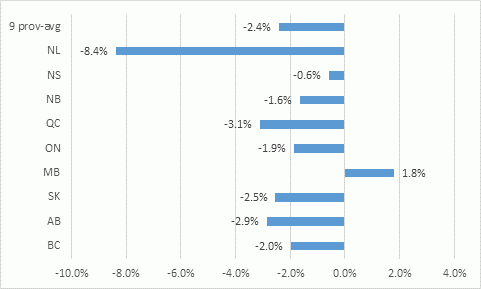
OK, on to the real numbers, which I believe are the worst since 1997 or so: this year, total budgeted transfers to institutions nationally (minus PEI) is a little over $16.9 billion. That’s down a little over $300 million in nominal dollars, for a fall (in real dollars) of 2.4%. There were only two provinces – Manitoba and Nova Scotia – where institutional transfers were bigger than last year’s, and of these only Manitoba actually saw an increase larger than inflation. As predicted back here, the province worst hit was Newfoundland, where the fall in the oil price tore a $1 billion hole in the budget, and as a result post-secondary expenditures took a hit of over 8%.
Changes in Operating Grants (Canada minus PEI), Budget 2014-15 to Budget 2015-16, Real $2015
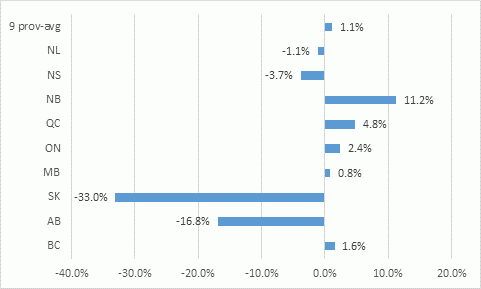
On the student financial aid (SFA) side, overall we see an increase of 1.1% in real dollars, but this conceals some major differences at the provincial level. Alberta is down nearly 17%, and Saskatchewan is down 33%. Whether this reflects changes in demand (fewer people applying, which would make sense demographically in Saskatchewan, at least), or the results of minor tweaks in need-assessment formulae, or simply the result of adopting new reporting practices, is difficult to tell. So far as I’m aware, neither province has introduced major changes to its student aid system this year, so it’s hard to see what’s driving these shifts (though having now published them, I’m pretty sure I’ll be getting calls/emails from both with explanations). On the other side, New Brunswick is projecting an 11% increase in student aid, which is both massive and a bit baffling given shrinking populations and capped tuitions.
Changes in SFA Budgets (Canada minus PEI), Budget 2014-15 to Budget 2015-16, Real $2015
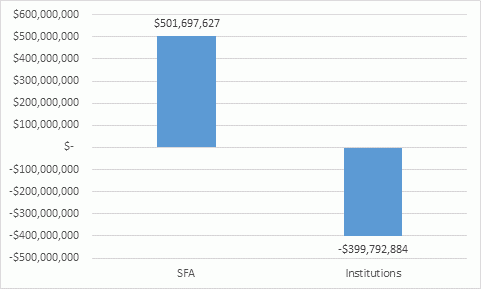
So what we see this year again is a continuation of the trend of increasing SFA support, and stagnant or declining institutional aid budgets. Just to give you a sense of what’s going on here, here’s the net increase/decrease in absolute funding for SFA and institutional budgets over the last four years.
Total Changes in Budgeted Expenditures (Canada Minus PEI), Budget 11-12 to Budget 15-16, Real $2012
Or, to put that in percentage terms:
Percentage Real Change in Budgeted Expenditures (Canada minus PEI), Budget 11-12 to Budget 15-16
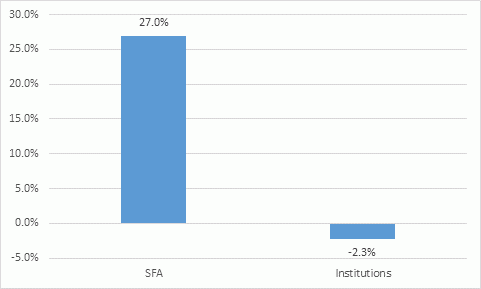
The SFA numbers, it needs to be said, are highly influenced by Ontario, which accounts for 75% of the increase in provincial spending. In fact, four provinces (BC, Saskatchewan, Manitoba, and Newfoundland) have actually seen decreases in SFA expenditure over the past four years, though that is likely because of healthy income growth related to resource prices – we’ll see if that holds next year.
So there you have it. Worst set of provincial budgets for institutions so far this century, but student aid still keeps growing. How long can the starve-the-institution, feed-the-students game last? My guess is this pattern will continue playing out for some time to come.
 Tweet this post
