

New income and expenditure data on Canadian universities came out over the summer courtesy of StatsCan and our friends over at the Canadian Association of University Business Officers (CAUBO), so today it’s time to check in on what the latest financial trends.
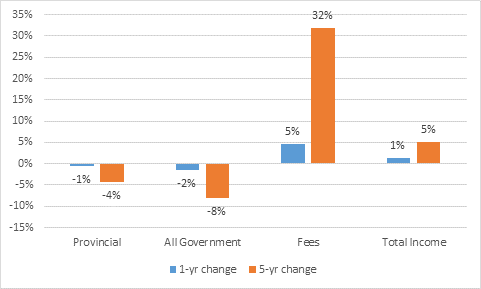
In 2014-15, income at Canadian Universities was, overall, a record 35.5 Billion dollars (just above 2% of GDP, if you’re counting). That’s up 1% in real terms over the previous year and up 5% on five years ago (2009-10). But the composition of that income is changing. Total government income is down 2% in real terms from last year and down 8% from 2009-10 (the latter being somewhat exaggerated because the base year included a lot of money from the 2009 budget stimulus via the Knowledge Infrastructure Program (KIP). Income from student fees, on the other hand, was up 5% on the previous year and 32% up from 2009-10, again taking inflation into account. That doesn’t mean that fee levels increased that much; this is aggregate income so part (maybe even most) of this change comes from changes in domestic and (more pertinently) international enrollment.
Figure 1: Change in Real Income by Source, Canadian Universities, 2014-15 vs 2013-14 and 2009-10
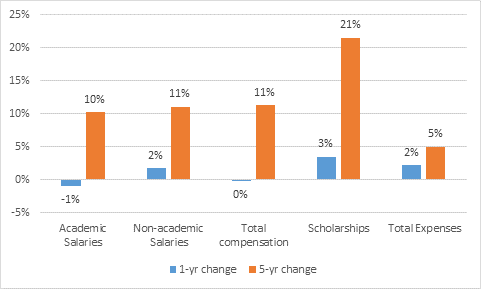
Let’s turn to a look at expenditures by type. Salary mass for academic staff actually fell slightly last year after inflation, but over five years the overall salary budget for academics is up by 10%, after inflation. Again, this isn’t what’s happening to average salaries, it’s what’s happening to aggregate salaries, so it’s partially a function of average and partially a function of staff numbers. For non-academic salaries, it’s an 11% increase over five years. And yes, you’re reading that right: labour costs have risen 10% while income has risen only 5%. Again, that’s exaggerated a bit by fluctuations in incoming funds for capital expenditures, but it’s probably not sustainable in the long term. Because other elements of the budget are increasing quickly too: for instance, scholarship expenditures rose by 21% over that period to stand at over $1.87 billion.
Figure 2: Change in Real Expenditures by Type, Canadian Universities, 2014-15 vs 2013-14 and 2009-10
Finally, let’s take a look at expenditures by function within the operating budget. Operating budgets as a whole are actually up quite a bit – 14% (this is partially offset by falls in the capital and research budgets). Here’s how the money gets used:
Figure 3 – Division of Canadian Universities’ Operating Budgets by Expenditure Function, 2014-15
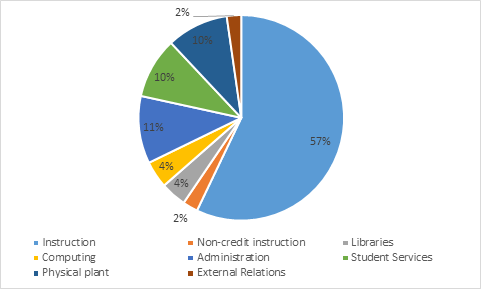
As you’d expect and hope, the lion’s share (57%) of the operating budget goes to instruction and non-sponsored research. Most of the rest goes on three categories: administration, student services, and physical plant. Figure 4 shows how growth in each of these areas has differed.
Figure 4: Change in Real Expenditures by Function, Canadian Universities, 2014-15 vs 2013-14 and 2009-10
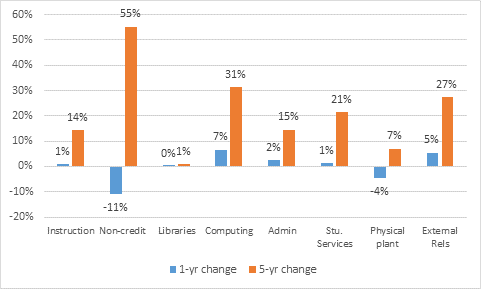
If you look at the “big four” spending areas, instructional and admin costs rose at roughly the same rate over fiver years (14% vs. 15%), while student services rose more quickly (21%) and physical plant less so (7%, with a 4% drop in the last year). Non-credit instruction is up very strongly for reasons I cannot quite fathom. But look at computing costs (up 31%) and “External Relations” (which includes Government Relations, alumni relations/fundraising and other marketing costs – up 27%).
In sum: i) government funding is down in real dollars but student income has replaced that income and more besides, so that institutional budgets are still increasing at inflation +1% per year; ii) compensation budgets (academic and non-academic alike) are rising faster than income, which is a problem for the medium-term and iii) there are a lot of small-ish budget items that are growing much more quickly than salaries (scholarships, computing, student services etc.) but given that compensation is 60% of the total budget, that’s still where the majority of the restraint needs to happen.
 Tweet this post

Would non-credit include remedial education? An increasing interest in access might explain offering more remedial courses, and particularly to overseas or non-traditional students.
Interesting question. From what I understand of the way the data is compile, no. Non-credit = cont.ed + ESL/FSL. I think.
Although I would be right about the ESL/FSL, since such things are mostly offered to overseas students, and by way of remediation.
It might actually be a good news story, in the sense that we’re bringing in more overseas students, and offering more to the community. In any case, thanks for bringing it up.
Very interesting post! I’ve searched high and low for those numbers. I have a question about the definition of “admin” vs. “instruction”. If a professor stops teaching and becomes a Dean, is her salary then counted as part of the admin budget or as part of the instruction budget?