

In yesterday’s blog, I ended on the observation that over the period 2000-2012 at the 12 major universities where we have data (UBC, SFU, Alberta, Calgary, USask, Manitoba, Carleton, York, Toronto, Waterloo, Western, and Memorial) the rate of growth of support staff and administration was 16% faster than the rate of growth of academic staff. To wit:
Figure 1: Growth in Support/Admin Positions vs Faculty Positions, 12 Large Institutions, 2000-2012
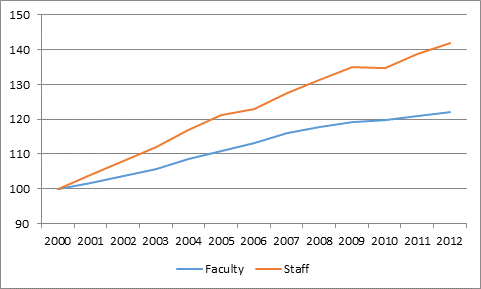
But that’s a 12-institution average. In fact, very few individual institutions exhibit anything like this pattern.
Figure 2 shows increases in faculty and staff complements at each of the 12 institutions. Some caution is required with the numbers: notably, while the definitions of “faculty” and “staff” are consistent over time at every institution, they differ across institutions in a number of ways. So what you want to focus on here, above all, is the inter-institutional differences in the gap between staff and faculty hires.
Figure 2: Patterns in Institutional Staff Growth, 12 Institutions, 2000-2012
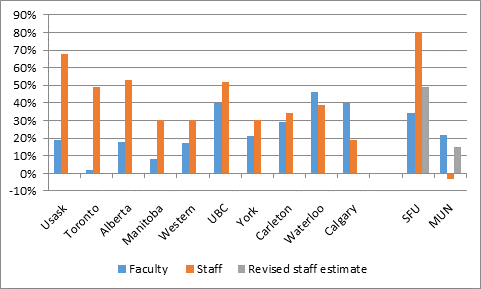
(To be clear: “staff” here includes any position that is not an academic post, the term does not only pertain to professional staff. I’ll get to why this distinction is important later in the post.)
To start at the left side of the graph: Saskatchewan, Toronto, and Alberta are three institutions where administrative/support hiring massively outstripped faculty hiring. At Saskatchewan, staff numbers went up 68% over the period 2000-2012, compared to faculty growth of just 19%. At Toronto, the comparable figures were 49% and 2%; at Alberta, it was 53% and 18%. These are places where claims of administrative bloat seem pretty clear cut.
But move along to the right, and one realizes the problem (if indeed it is one) isn’t universal. At places like UBC, York, and Carleton, growth in admin/support is only slightly higher than growth in faculty numbers (note: our time period misses some of the recent growth from 2013 & 2014, to which Gary Mason’s article referred. At Waterloo and Calgary, faculty numbers increased more quickly than admin/support numbers from 2000-2012.
(If you’re wondering why SFU and MUN are off to one side, it’s because, over the course of the past decade, these two seem to have had some kind of change in how support staff were counted. In MUN’s case, it seems to have resulted in a one-time loss of about 300 staff; at SFU, it led to a gain of 300 staff. As a result of these shifts, SFU’s growth in support staff looks titanic, while Memorial appears to have shed staff. Neither scenario is likely. The grey bar for those two institutions are my very crude “best-guess” attempt to adjust for these definitional changes.)
The lesson here is that there really isn’t a single pattern prevalent across all institutions. At some places, admin/support numbers are clearly growing wildly; at others, they are pretty stable. It’s therefore probably better if people stopped making generalizations on this topic.
In the next post on this subject, which I’ll do sometime next week, I’ll try to answer the question: what are all these new staff doing, anyway?
 Tweet this post

In your next post, I hope you try to delineate between administrative staff that are revenue generating — or at least no net cost to the institution — eg. development, parking, continuing studies, residence and food service, in some cases, athletics) and those that are operating-budget supported. I have always wondered how big a part those things play in “administrative bloat.”
Hi Deanne. I’m going to break it down as much as I can. Which is probably not as far as either of us would like.
Hi Alex: Deanne makes an interesting point above re: breaking down where the growth is. I would be really interested to see how much of the proportional growth in administration is due to IT. As large, complex organizations, universities require an increasingly large amount of IT infrastructure and support. These are big expenditures that may have grown over the past 15 or 20 years at a faster rate (be it people hired or dollars spent) than what we see in other administrative areas. Just a thought…
I’m going to have to disappoint you there: though I will be showing some disaggregations of the staff data, none of them get to that level (in part b/c IT staff are often spread across different university functions – some work for the CIO, some work in labs, some work directly for central admin units, etc). But you’re right, that is part of whats going on.
Hi Alex,
I am wondering, does faculty include data on contract and part-time faculty? Where are graduate students employed as research or teaching assistants, lab assistants, work-study students, included? They are staff, but a large increase in their numbers does not imply administrative bloating. Does your data differentiate between full-time and part-time staff?
Thanks!
Fair questions and I should have gone into more detail. Faculty data in all cases is TT faculty. I believe (but am not 100% certain) that it includes PT faculty in most if not all cases, but very definitely *excludes* grad students, sessionals, etc (I have not included these on the “staff” side, either). Where institutions exclude PT staff (which IIRC is almost everywhere) I exclude them too.
Interesting read.
Two questions:
1) what are the sources you use? 40% faculty growth at UBC, Waterloo, and Calgary sounds huge and out of sync with anecdotal experiences.
2) how do the numbers look if you shift the start date, e.g. to 2005 – I am wondering if the differences between schools reflect phase misalignment rather than trends.
I’m using whatever data the institution itself publishes. Definitions will be mostly internally consistent but not necessarily consistent across institutions. UBC data is from the usual place: http://www.pair.ubc.ca/statistics/facstaff/index.shtml
Re 2: Picture changes a bit if you narrow it to 2005: Now three institutions have faster faculty growth than staff growth (instead of two) but in general the gap between the two shrinks.
Interesting data. At my institution we have hired quite a few full time lecturers, lab demonstrators, etc. who are largely doctoral-level and primarily focused on undergraduate teaching but are classified as “staff” not “faculty” (since they are not expected to get grants and lead research groups). I suspect that it will be tough to sort out such nuances in your available data.
Thanks for the link.
Two interesting tidbits which I wonder if you or anyone can explain.
1) according to http://www.pair.ubc.ca/statistics/facstaff/facstaffcount.xls the number of staff at UBC dropped by over 10% in one year, from 2013/14 to 2014/15 from 9129 to 8096…. This is just pre Gupta stepping in. Any explanations?
2) still at UBC, the number of staff in middle manager category went from 389 in 2000 to 861 in 2013, i.e. the number doubled
http://www.pair.ubc.ca/statistics/facstaff/fac&staff_occupational_group_UBCV.xls. Is this typical?
No idea. I stopped at 2012 because it was the last year for which I could get common data. The middle-management things sounds like a re-categorization, which is irritating if they don;t back-date the definitional change (trend data becomes useless)
Alex, I’d be curious to know the breakdown, not to much by dollar, but by category. For example, hiring a support person to do photocopying and prepare travel claims for a faculty members seems to be a good use of resources. Hiring a Vice-President Overseer of Support Staff, with an associate VP, whose duties include attending conferences on the subject, does not.