

I have been perusing a quite astonishingly detailed survey that was recently released regarding student health. Run by the American College Health Association-National College Health Assessment, this multi-campus exercise has been run twice now in Canada – once in 2013 and once in 2016. Today, I’m going to look at what the 2016 results say, which are interesting in and of themselves. Tomorrow, I’m going to look at how the data has changed since 2013 and why I think some claims about worsening student health outcomes (particularly mental health) need to be viewed with some caution. If I get really nerdy over the weekend, I might do some Canada-US comparisons, too.
Anyways.
The 2016 study was conducted at 41 public institutions across Canada. Because it’s an American based survey, it keeps referring to all institutions as “colleges”, which is annoying. 27 of the institutions are described as “4-year” institutions (which I think we can safely say are universities), 4 are described as “2-year” institutions (community colleges) and 10 described as “other” (not sure what to make of this, but my guess would be community colleges/polytechnics that offer mostly three-year programs). In total, 43,780 surveys were filled out (19% response rate), with a roughly 70-30 female/male split. That’s pretty common for campus surveys, but there’s no indication that responses have been re-weighted to match actual gender splits, which is a little odd but whatever.
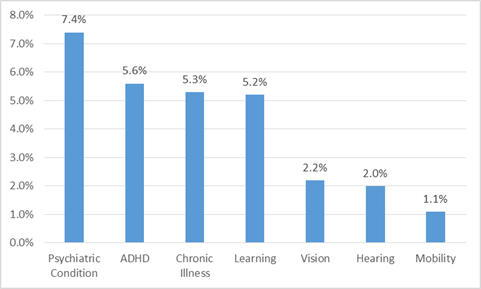
There’s a lot of data here, so I’m mostly going to let the graphs do the talking. First, the frequency of students with various disabilities. I was a little bit surprised that psychiatric conditions and chronic illnesses were as high as they were.
Figure 1: Prevalence of Disabilities
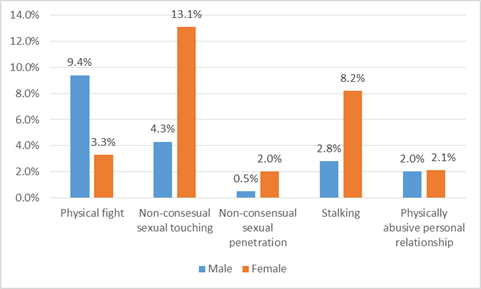
Next, issues of physical safety. Just over 87% of respondents reported feeling safe on campus during the daytime; however, only 37% (61% of women, 27% of men, and right away you can see how the gender re-weighting issue matters) say that they feel safe on campus at night. To be fair, this is not a specific worry about campuses: when asked about their feelings of personal safety in the surrounding community, the corresponding figures were 62% and 22%. Students were also asked about their experiences with specific forms of violence over the past 12 months. As one might imagine, most of the results were fairly highly gendered.
Figure 2: Experience of Specific Forms of Violence Over Past 12 Months, by Gender
Next, alcohol, tobacco, and marijuana. This was an interesting question as the survey not only asked students about their own use of these substances, but also about their perception of other students’ use of them. It turns out students vastly over-estimate the number of other students who engage with these substances. For instance, only 11% of students smoked cigarettes in the past 30 days (plus another 4% using e-cigarettes and 3% using hookahs), but students believed that nearly 80% of students had smoked in the past month.
Figure 3: Real and Perceived Incidence of Smoking, Drinking and Marijuana Use over Past 30 Days
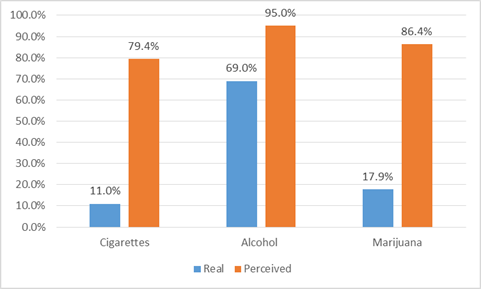
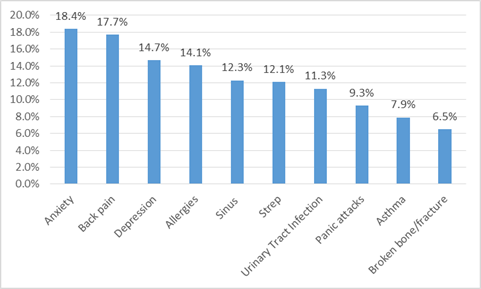
Figure 4 shows the most common conditions for which students had been diagnosed with and/or received treatment for in the last twelve months. Three of the top ten and two of the top three were mental health conditions.
Figure 4: Most Common Conditions Diagnosed/Treated in last 12 Months
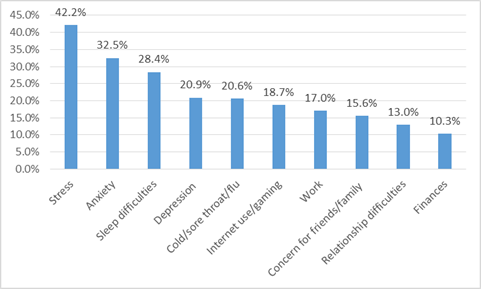
Students were also asked separately about the kinds of things that had negatively affected their academics over the previous year (defined as something which had resulted in a lower mark than they would have otherwise received). Mental health complaints are very high on this list; much higher in fact than actual diagnoses of such conditions. Also of note here: internet gaming was sixth among factors causing poorer marks; finances only barely snuck into the top 10 reasons, with 10.3% citing it (though elsewhere in the study over 40% said they had experienced stress or anxiety as a result of finances).
Figure 5: Most Common Conditions Cited as Having a Negative Impact on Academics
A final, disturbing point here: 8.7% of respondents said they had intentionally self-harmed over the past twelve months, 13% had seriously contemplated suicide and 2.1% said they had actually attempted suicide. Sobering stuff.
 Tweet this post

Be careful of that data… the dropout rate, due to the highly invasive and incredibly long and repetitive survey means that many students do not even make it to those questions.
In our study of it, asking similar questions on a more general student survey (with lower dropout) actually resulted in much higher rates of wellbeing issues than those on the NCHA – on a survey done only 1 week later. our thinking is that students with higher levels of stress, anxiety, etc. are more likely to drop out of the NCHA survey, so are not captured in that data. We have stopped using the NCHA survey because of this and other methodological challenges with the data as well as with how it gets reported.
Figure 3 is interesting, but might what is labeled as ‘real’ be slightly under-reported? I might not want to admit that I have smoked, either to myself or to a survey, no matter how anonymous. For clarity’s sake, I might replace the word ‘real’ with ‘self-reported’.