As I noted yesterday, Canada is unnecessarily bad at looking at medium-term outcomes of education. The only place where we have data on university graduates even five years out is in BC, and they publish the data in such a weird format (seriously: check it out) that no one really explores them.
It could be worse. In 2005, Statscan, did a 5-year follow-up of the class of 2000 and elected not to publish any results relating to employment or income. *Facepalm*, as the kids say.
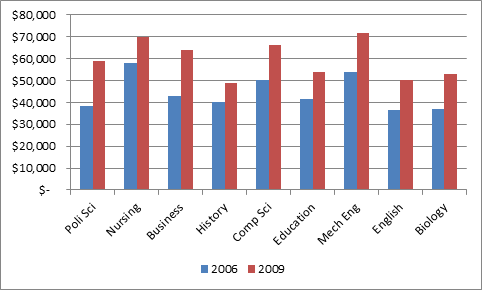
However, because I have nothing better to do, I have put together three interesting figures on how graduates fare between years 2 and 5, in select disciplines (chosen because of sample size). It’s all courtesy of that same BC data on the graduating class of 2004. I won’t bore you with employment both at 2 and 5 years, it’s uniformly quite low. Let’s start instead by looking at incomes five years out. It turns out that while some disciplines do have precarious earnings in the first two years after graduation, median incomes rise across all fields by 35% between years 2 and 5 (that’s more than 10% per year, if you’re counting). Just for comparison, the median earnings among all Canadian workers in 2009 was $46,500. So, even in the “soft” disciplines, the ones that allegedly leave people without valuable skills like English and History, graduates five years out show median incomes above the national average.
Figure 1 – Median incomes, 2 and 5 years out, BC class of 2004, selected disciplines
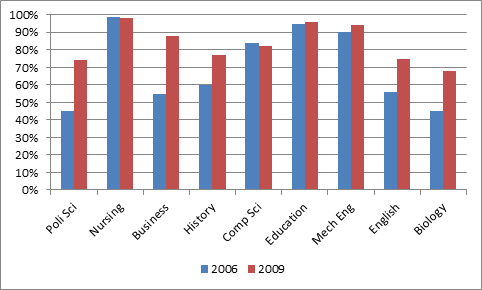
Ah, you say: but are they using their skills? Aren’t they, perhaps, underemployed? Well, not really. Figure 2 shows the percentage who are in jobs which have been classified by the National Occupation Classification system as either being managerial or requiring university education. In the three disciplines where that percentage is lowest after 2 years (Biology, English, and Business) the rates of employment in high-skilled jobs jumps by 50-65% in the following three years. Five years out, the difference between history grads and computer science grads is only five percentage points.
Figure 2 – Percentage of graduates in jobs classified as “Management” or “Skill Level A” by NOC, 2 and 5 years out, BC class of 2004, selected disciplines
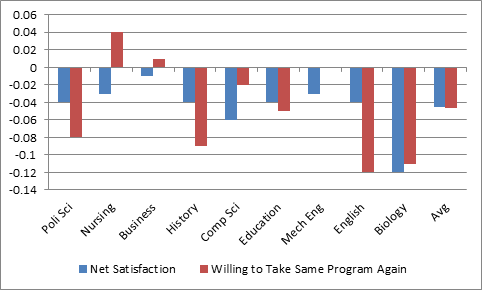
What’s perhaps most interesting is how graduates feel about how their education changes over time (figure 3). Across the board, graduates five years out feel less satisfied with their education and are less likely to say they’d do the same program again that they did at two. But while there’s a generalized malaise among students, the regret factor is clearly a lot higher in arts and science programs than it is in professional ones.
Figure 3 – Percentage-point change in graduates indicating satisfaction with program and indicating they would take same program again, 2 and 5 years out, BC class of 2004, selected disciplines

Anyways, that’s just what one bored dude can do with available data on a crappy 12-hour flight. Imagine if governments actually wanted to improve data and analysis in this area! Possibilities: limitless.


 Tweet this post
