

Every once in awhile, it’s good to go searching through statistical abstracts just to see if the patterns you take for granted can still be taken for granted. So I recently went hunting through some CSLP annual reports and statistical abstracts to see what I could find. And I’m glad I did, because there are some really surprising numbers in the data.
So here’s the really big take-away: the number of students borrowing from the Canada Student Loan Program rose from 365,363 in 2008-09, to 472,167 in 2012-13. In just four years, that’s an increase of 29%. Which is kind of staggering. It’s therefore important to ask the question: what the heck is going on? Where are all these new borrowers coming from?
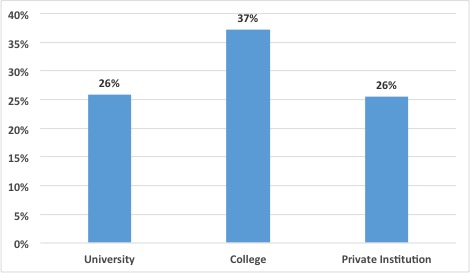
Well, for one thing, we know it isn’t being led by a new wave of students in private, for-profit institutions. In fact, the increase occurred across all types of institutions, with a slightly more pronounced growth among students in community colleges.
Figure 1: Growth in Number of Student Borrowers by Type of Institution, 2008-09 to 2012-13
It’s a different story when we look at borrowing growth by province. Here, we see a more straightforward – and somewhat puzzling – story: borrower numbers are up fairly substantially everywhere west of the Ottawa river; however, numbers are even, or down slightly everywhere in the Atlantic (note: because we are looking only at CSLP borrowing, there is no data for Quebec, which has opted out of the program).
Figure 2: Growth in Number of Student Borrowers by Province, 2008-09 to 2012-13
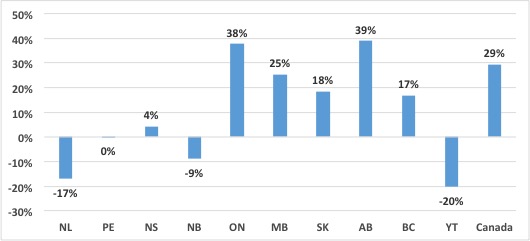
One thing that Figure 2 obscures is the relative size of the provinces, and thus the portions of growth in borrower numbers. Ontario, where growth in borrower numbers has been 38%, actually accounts for over three-quarters (77%) of all growth in borrowing within the CSLP zone; in total, Ontario now accounts for nearly two-thirds (64%) of the CSLP loan portfolio.
You can’t explain Figure 2 in terms of economic fundamentals: neither the recession’s effects nor education costs were that different in the Atlantic. To a considerable degree, what Figure 2 is really showing is population change: youth populations in the Atlantic are shrinking, and that is primarily why their borrower numbers are going down (Newfoundland is falling even further because of real declines in costs and – probably – because family incomes rose quickly in this period thanks to the oil boom).
To get a better look at changes in the borrower population by province, we need to look at changes in the percentage of full-time students who are borrowing. Now, it’s difficult to do this because CSLP itself doesn’t calculate this figure, and doesn’t quite break down figures enough to do it accurately. So below in Figure 3 what we show is the number of total borrowers (including at private vocational colleges), divided by the number of students enrolled full-time in public universities and colleges. This will slightly overstate the percentage of students borrowing (borrowers at private colleges make up about 10% of the borrowing population, so mentally adjust the numbers downward if you would); also, the denominator is total students enrolled in the province, not originating in the province, so Nova Scotia’s figure in particular is an undercount because of all the out-of-province students there. With those caveats in mind, here are the percentages of students borrowing across the country:
Figure 3: Percentage of Full-Time Students with Loans, by Province, 2008-09 and 2012-13

The percentage of students borrowing grew in every province except Newfoundland, Saskatchewan, and New Brunswick. But the real story here is Ontario, where the percentage of students borrowing jumped by nine percentage points (from 44% to 53%), which led to a national rise of seven percentage points (42% to 49%). It’s not entirely clear why there was such a jump in Ontario. The recession there was not that much more severe than elsewhere, and student costs, though high, were not rising that much more quickly than elsewhere. Part of the answer may be that in the last couple of years the new Ontario Tuition Grant has been in effect, which enticed higher-income students into the student aid system with its outrageous $160,000 family-income cut-off line. But that can’t be the entire story, as growth in numbers was actually fairly steady from year-to-year.
What might be going on? My guess is two things. First, student numbers are expanding in most provinces. Almost by necessity, if expansion is happening, it is going to happen disproportionately among those who we traditionally call “underserved” (that is, the poor, students with dependents, etc.), who by definition are more likely to be eligible for student aid. This is to say, what we are seeing here is not evidence of a problem, but rather evidence of student aid working exactly as it should, to expand access.
The second factor is what I call delayed recognition. Back in the 2000s, student aid eligibility for dependent students was expanded enormously. Essentially, we went from a situation in 2003 where most families saw eligibility for student aid end at around the $85,000-$90,000 mark in family income, to one in 2006 and thereafter where the cutoff rose to about $160,000 (the number varies a bit by province and family size, but that’s roughly the scale of the change). However, much to everyone’s surprise, take-up rates barely rose, presumably because CSLP didn’t go out of its way to advertise the changes much. What may be happening is that families across the country – but especially in Ontario – may finally be cluing in to how much assistance they are entitled to under the post-2006 rules, and acting accordingly. In other words, this could just be an improvement in take-up rates rather than a deterioration in family and student finances.
 Tweet this post

I suspect you’re hypotheses are correct. Does CSLP (or any province) track application numbers over time? Is the proportion of applications that qualify for aid increasing?
Regarding your last hunch, it could be a collateral effect of the psychological impact of tuition fee increases. While increases might not have been huge, the impression of them might have reached a tipping point phase where a disproportionate number of families are willing to consider student aid.