

I was in Berlin last week giving a keynote at the 20th Anniversary conference of the CHE (Centre for Higher Education Policy). The topic was – promise not to laugh – “What Germany can Learn From Canada”.
You said you wouldn’t laugh. Last time I trust you lot.
Anyways, the speech basically revolved around the following graph, which shows Canada’s impressive increase in university participation rates:
Figure 1: 18-21 University Participation Rates, Canada, 1992-2014
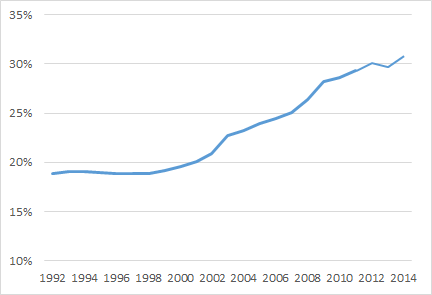
So, what did we actually do as a country to achieve this? Can you name a single province that said: “hey, let’s increase participation rates by 60%! And here’s an integrated series of policies to get us there!”
Of course you can’t, because it didn’t happen (apart from Ontario eliminating OAC, but that’s a pretty small effect). Canadians never plan anything. We just muddle through, and then try to explain what it is we did as if we’d had a clue to begin with. But try explaining that to a crowd of Germans. I had to fall back on the whole “Canada is a country that works in practice, but not in theory” gag. Still, it’s an interesting question: If no government or institution set a 60% growth target fifteen years ago, how did we get here?
Clearly, part of it is demand. In the 1990s, we still had a lot of unmet demand, especially in Alberta and British Columbia. There were simply not enough spots to grow around, and so, in part, growth was just a matter of satisfying existing demand. But demand has clearly risen since then, too. And why not? Employment levels for university grads have remained higher than those for other fields of study (in most provinces, anyway) and so have pay levels, even if the gap between university and college has narrowed a bit.
But what made institutions choose to accept these students? Check out what was happening to operating income per student.
Figure 2: Average Operating Income per FTE Student, Canada, 1992-2012
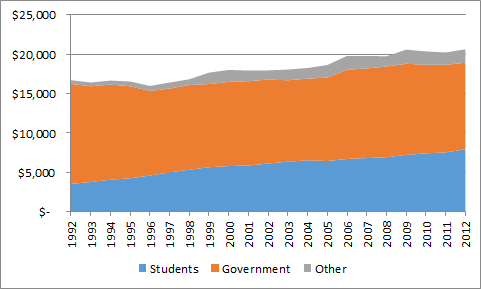
Basically, we threw money at universities so they would take more students. Even after increasing student numbers by about 50%, universities were getting more money per student, in real dollars, than they were before the expansion. Institutions simply couldn’t lose by expanding.
This would be easy to explain if in fact universities benefited from formulae that would increase money automatically as student numbers increased. Now, what’s interesting here is that while governments did increase money every year, they did so regardless of whether they had formulae. As long as students came, money flowed. But grant money alone wouldn’t have allowed universities to keep pace. The rise in tuition fees was necessary to keep the gates open.
But here’s the weird thing: despite all the increases in fees, students didn’t actually end up paying more. In net terms, costs remained about the same because of the significant increases in various type of subsidies – especially tax credits.
Figure 3: Fees, Net Fees, and Net Fees After Tax Expenditures (TE), Canada, 1992-2009
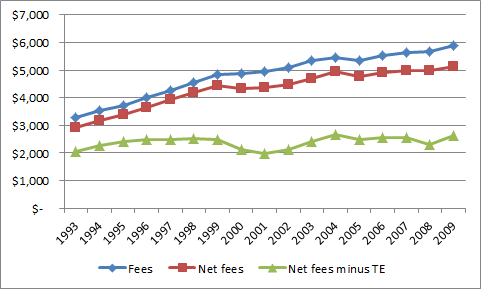
(Yeah, I know, the data’s a little old on that figure. It’s the best I’ve got. Sorry.)
In other words, apart from international student fee income, all the extra fee revenue institutions picked up over the last fifteen years was just government subsidy flowing indirectly to institutions. Like a huge crazy voucher program in disguise.
Did anyone plan this? No. It was a mix of independent federal and provincial decisions, reacting to societal demand for more education. We muddled through. But boy, in retrospect, it seems like an awfully messy way to have got here.
Maybe time for a policy clean-up?
 Tweet this post

Excellent blog post.
Quick question: Are figures in Figure 2 expressed in constant dollars?
Thanks Nick. Yes they are constant $ – my bad for not having indicated so on graph. $2013 IIRC.
Sorry – actually $2012
Interesting as ever, Alex, but I’d like more detail on the graphs (starting with whether these are real-dollar measures, and if so for what year).
The middle graph appears to show that _government_ funding per student (the orange spread) has remained almost exactly the same over twenty years at around $12,000, but it’s hard to tell precisely. Startling if true. Is it?
Hi Ryan. Yes, they are in constant dollars. $2013 IIRC. Government support for operating grants (these numbers exclude research money) per student fell from $12,700 from 92 to $10,500 in ’98, then rose again steadily back to about $11,600 in 2010, since when it has been declining slightly (2012 = $10,990).
I know, this is not the story you usually hear. But it’s true.