

The National Graduates Survey figures on debt for the class of 2010 were (quietly) released yesterday. Unlike the employment data they released a few weeks ago, this data actually *is* comparable to results from previous surveys. It is thus a good way to check on whether/how student debt is actually reaching “out of sight” levels.
So, let’s start with some interprovincial comparisons.
Average Government Student Loan Debt at Graduation, Borrowers Only, By Province and Type of Institution, Class of 2010
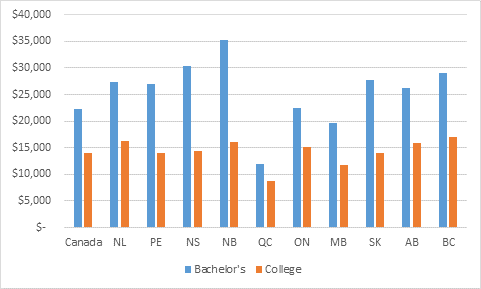
The national average government debt among borrowers was $22,300 for university graduates, and $14,000 for college graduates. However, this conceals some pretty wild differences between provinces, especially at the university level where the provincial means extend from $11,900 in Quebec to $35,000 in New Brunswick. Of particular interest is the fact that Ontario, the province with the highest tuition, actually has among the lowest levels of debt (indeed, between 2000 and 2010, it fell nearly 17% in real terms).
Looking at the data over time, the next two figures show how government student loan debt has evolved:
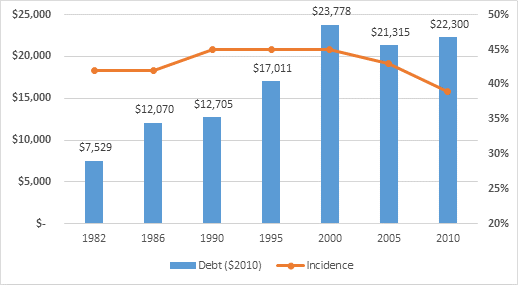
Incidence and Mean Amount of Government Student Loan Debt at Graduation, Bachelor’s Degree Borrowers Only, 1982-2010
Incidence and Mean Amount of Government Student Loan Debt at Graduation, College Borrowers Only, 1982-2010
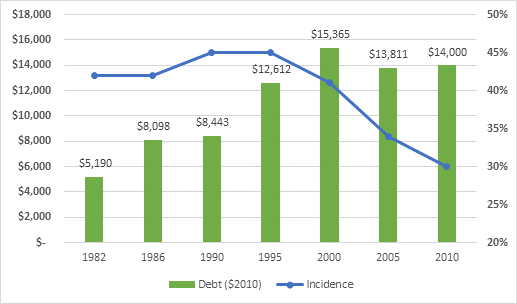
The takeaway here: despite steadily rising tuition, the percentage of students taking out need-based loans to finance their education hit a thirty-year low in 2010. Debt was still high, but in real dollars was below where it was in 2000.
Now, while need-based government debt has been falling, non-need-based (or at least, not necessarily need-based) private debt has been rising. Private debt is a mish-mash of credit card debt (which most surveys suggest is pretty small), private bank loan debt, and debt to family members – the last of these is presumably fairly soft debt in the sense that it is available on highly negotiable terms and there is a reasonable chance of some form of debt forgiveness. Incidence of all forms of these debt combined has risen from 19% to 26% among bachelor’s graduates since 2010 (16 to 22% among college grads), and average debt from these sources (among those with any amount of such debt) has risen from $13,170 to $17,700 for bachelor’s graduates ($8,300 to $10,000 for college graduates).
It’s not clear what to make of the private debt figures. For the 15% of the student population that has both public and private debt, one assumes that the recourse to private debt is indicative that for this part of the student body, the existing student aid packages are inadequate. This is a group we should be pretty concerned about. As for the other 11% who only have private debt, it’s hard to say what the issue is. Why are they choosing private money over public money? Are they actually fairly well-off, and hence ineligible for aid? We simply don’t know.
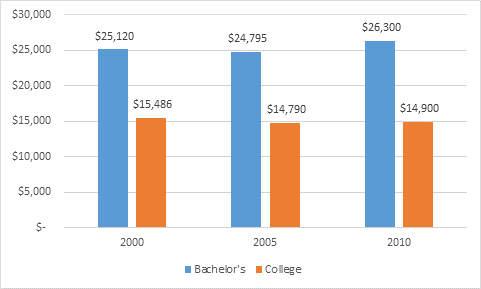
In any case, as a result of this increase in non-public debt, total debt is up very slightly, as we see in the figure below. But while the averages of debt are up, the incidence is down – from 53% to 50% on the university side, and from 49% to 43% on the college side. And this, recall, in a period where participation rates were growing sharply.
Average Total Debt at Graduation, Borrowers Only, By Type of Institution, Classes of 2000, 2005 and 2010
So: government debt down, private debt up. Incidence of total debt down slightly, average debt up slightly. Any way you look at it, the basic picture on student debt is right where it’s been for the last decade. And meanwhile, interest rates have fallen, and after-tax incomes have risen.
I know facts never get in the way of a good story, but: There. Is. No. Crisis. Period.
 Tweet this post

Hi Alex,
Thank you for publishing this data. However, I have a few questions because it doesn’t really jive with other studies I’ve seen, or my experience as an B.Sc. to M.Sc. to Ph.D. scattered between 1997 and 2013.
1. Isn’t there a crisis if you consider pre-2000 data? I have always thought we take a generational view when discussing student debt load, in which case, your numbers confirm that the millenials have it much rougher than other generations. Further, tuition continued to rise dramatically over the last 4 years, which you don’t acknowledge.
2. The shift from public to private debt is a large part of the story and while you mention it you don’t attempt to address what that means in terms of real debt to an individual. Graduate scholarships have been plummeting over the last decade (e.g. NSERC post-doctoral fellowship from 30% to 8% acceptance). So now more students rely on bank loans and credit cards. Further, a student might not be able to apply for need-based loans because their parents have adequate incomes, but that doesn’t mean the parents are paying for their education. Did you factor this into your argument or is it even possible to tease apart student vs. normal debt when its all private? Also, do you factor in income tax deductions like textbook and tuition? I imagine its hard to do, but lenders give it a shot and as a comparison, check out what Equifax thinks of young US adult credit scores with student debt (in short its not great).
http://www.brookings.edu/research/papers/2014/05/student-loan-debt-rising-gale-harris
3. After-tax income might be rising but not necessary for all university graduates, and not equally across the country. If you look at wage increases provincially the three provinces with the greatest student debt (NS, NB and BC) also have the lowest average wage increases (with the exception of QC for which wage are decreasing). Further, underemployment vs. unemployment is a big problem in Canada and not well described in financial stats, which means that any student debt is harder to pay off.
http://www.statcan.gc.ca/daily-quotidien/140130/t140130a001-eng.htm ….although its summarized here:
http://www.workopolis.com/content/advice/article/how-much-money-are-we-earning-the-average-canadian-wages-right-now/
http://www.canadianlabour.ca/news-room/publications/underemployment-canadas-real-labour-market-challenge
Thanks for this report, I think every bit of data helps, and I’m really am just curious how you address these three main points under your conclusion that “there is no crisis.” I understand that the stats get blown out of proportion in the public press (I recently worked out the probability of getting a tenure track job in CA and US, and while low it wasn’t as bad as the papers made it out to be), but at this point even with your data I’m not convinced there is not a problem with student debt levels.
Hi there. Thanks for your thoughtful post. To respond briefly:
Well, you can see the historical evolution of government debt in slides 2-3. Yes, debt levels are now higher than they were in 90s – but in terms of repayment burdens they are back down to about where they were in early 90s. lower interest rates and highgh after-tax incomes make a big difference. See here: https://higheredstrategy.com/why-student-debt-burden-is-falling-like-a-stone/
I would firmly disagree with the contention that tuition had risen dramatically in last 4 years. It;s up about 3% per year, 0r less than 2% p.a. in real terms. Of which 25% goes straight back to students/families through tax credits. And grant aid to students is up something like half a billion since 2010, which more than covers the tuition increase. This is presumably why CSLP is showing falling debt since 2000.
Neither would I agree that grad scholarships are going down. The increase in institutional funding to grad students over the past few years has been phenomenal Up from $300M to $1.6B between 1995 and 2011. Tri-council funding for grad students is up as well. (Can;t speak to postdocs).
Re: geographic differences. Yes, there are some, and some parts of the country do better than others – this is unsurprising: as with any average some are above and some are below. I don;t see how the underemployment question matters much if overall income levels are steady or rising. You may be underemployed but if after-tax income is rising how is student debt harder to pay off?
Hi Alex, thank you for the responses, and I also got a chance to explore your other posts. All very helpful – and I will pass on this site onto students I often mentor who ask about the pros and cons of undergrad or post-grad degrees. Its a great resource.
Our numbers and perspectives differ slightly, I have tuition increasing by 4% since 2008, and NSERC’s Undergraduate Awards did not increase if you factor in enrollment (per capita amount peaked in 2008 but was lower in 2009 and 2010 than 2002). But certainly Canada enjoys some great institutional HERD funding although it is falling relative to OECD countries. Also, when I look deeper at after-tax incomes rising its often driven by wages in AB or SK for jobs for which a university degree is not necessarily required (ie. construction) or from a minority of specialized degree jobs (engineers and doctors), so for the general graduating class it very well might skew the data. Thanks for the post on the tax credits though, that is very helpful: https://higheredstrategy.com/why-is-student-debt-not-increasing/
Regardless of these differences, I take your point that the student debt crisis is more nuanced than typically presented, and I will be better suited to judge the public press and policy thanks to these posts. Cheers.
Your point is well-taken, both here and in the wider article, and it’s good to have more stats. I think, though, that you miss the burden of point 3: there might not be a _general crisis_ of student debt, but there might nevertheless be a large number of _individual crises_ buried in the averages. Is the number of defaults going up? Could the better employment outcomes just mean that graduates who didn’t take out debt in the first place now have better jobs?
The fact that, as you point out in the original article, the number of student debtors is going down, while the total level of debt is going up (albeit slightly) might mean that (say) the bottom quartile of students are taking out much more debt than ever before. In other words, we could still have a debt crisis of sorts, but it’s not a general handicap hanging over an entire generation, so much as a betrayal of the promise of entry into the middle class through education.
It would be nice to see some stats on the distribution of student debt. Is there a minority of students whose lives will be blighted for decades?
Thank you, Sean for pointing out an angle on student debt that is under-reported. Discussion about student debt tends to focus on averages/means and I agree the data is encouraging. What concerns me is the minority of students who are graduting with excessive levels of debt. There are certain risk factors such as being a single parent. I know two single parents at my school who have student loan debt of $112,000 $96,000 What is excessive or unmanageable debt?
We are still trying to get a handle on this.
Thank you, Sean for pointing out an angle on student debt that is under-reported. Discussion about student debt tends to focus on averages/means and I agree the data is encouraging for the majority of student loan borrowers. What concerns me is the minority of students who are graduting with excessive levels of debt. There are certain risk factors such as being a single parent. I know two single parents at my school who have student loan debt of $112,000 and $96,000 respectively. This does not include other debt they may be carrying. BC cut the provincial grant in 2004 and cut back on the Nursing Education Bursary a few years ago.
What is excessive or unmanageable debt? And how do we help those students manage both while in school and after graduation?
I’m also interested in the distribution behind the averages, though more from the point of view of regional or provincial differences, which we know exist. Are these staying relatively the same or are soem provinces/regions trending up while others are trending down? Maybe something to look at in future.