If there’s one thing everyone knows, it’s that Canadian universities have had a hard time of it during the recession during the last few years, yes? Absolutely starved for income because of government cutbacks, etc etc.
Not so fast. Check out this data on university operating budgets from the CAUBO/StatsCan financial survey:
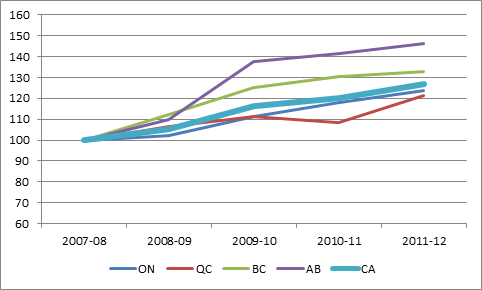
Figure 1: Indexed growth in University Operating Budgets 2007-08 to 2011-12
That’s right – across the country, university budgets went up by 28% between 2007-08 and 2011-12. That’s more than twice the rate of inflation. (Note: if you’re wondering why Alberta skews high, its because MacEwan and MRU were re-classified as universities in 2009 – take them out and Alberta basically looks like BC).
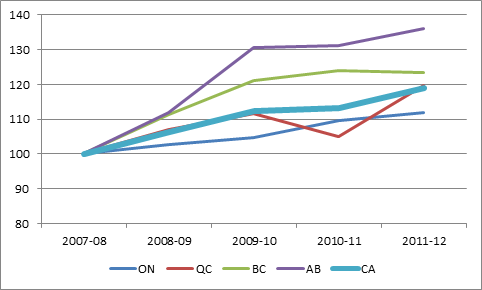
How is this possible, you ask? Haven’t governments been cutting back? Well, the last two years haven’t been very good, but let’s not project that too far backwards. In fact, during the heart of the recession years, the worst any major province fared (Ontario – big surprise) was to keep pace with inflation. Across the four big provinces which make up 90% of our national system, spending was actually up nearly 20%.
Figure 2: Indexed Growth in Government Contributions to Operating Grants, 2007-08 to 2011-12
Those of you with heads for numbers may now be scratching your heads. Government grants are a little over half of all institutional income. So if overall income is up 28%, and this half of it is only up 20%, that means the other half – the student half – must be up by…
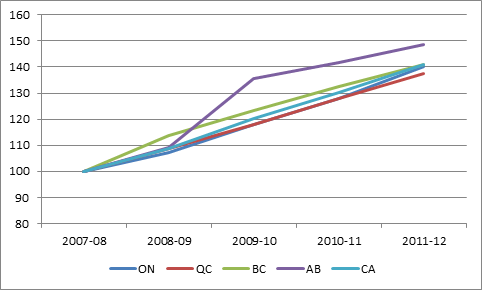
Figure 3: Indexed Growth in Tuition Income, 2007-08 to 2011-12
Yeah, that’s right: tuition income is up 40%. Four. Zero. How is this possible when Statscan says tuition fee increases are only about a third of that? Because this is aggregate tuition and Statscan looks at average tuition. One is larger than the other partly because of increases in domestic enrolments, but more importantly because of spectacularly increased international enrolments, which also carry much higher tuition fees.
Obviously, with extra students come extra costs, which is why it doesn’t necessarily feel like there’s 28% more money floating around these days. Between enrolment increases and cost increases (mostly labour costs, including rise through the ranks (Link to: https://higheredstrategy.com/rise-through-the-ranks-rtr/)), Ontario is still slightly down on the deal in per-student terms, while other provinces are up, but only slightly.
“Cutbacks” aside, governments are still spending far more than they were on PSE six years ago (even in Alberta) and institutions have been absolutely raking in cash from tuition. We don’t have the 2012-13 numbers yet, but they’ll likely be in the 8-9% range everywhere except Quebec. That means operating budgets overall likely expanded by about 3-4% last year, even as governments reduced funding.
Two final thoughts: One, if institutions still feel squeezed when income is rising twice as fast as inflation, it means there are some serious issues to work out on the cost side. And two, God help us if those international students stop coming.


 Tweet this post

The dip in Quebec for 2010-11 is due to a change in reporting year that led to an eleven-month calendar. Quebec numbers in that year should not be used because they aren’t comparable.
I wondered if it was some kind of timing issue. Thanks for that.
Gotta love how available income for schooling goes down and tuition costs go up. Well done Canada.