

Yesterday we compared provinces on PSE spending as a percentage of GDP – that is, as a percentage of their ability to pay. More or less, what we found was that most provinces were pretty similar, at 2.5% of GDP, with Saskatchewan a bit lower, Alberta a lot lower, and Nova Scotia and PEI much higher. But provinces have different economic capabilities and different student participation rates. So how do all these different expenditure patterns play out where it counts, in dollars per student?
Before I get into the actual numbers, some quick explanatory notes: all income and enrolment figures are for 2011-12, and expressed in 2012 dollars. The income figures represent all income, not operating, meaning that any big capital projects in that year will skew things a bit. The “government” figures include both federal and provincial spending. To keep things relatively consistent, I express student numbers in Statscan FTEs (3.5 PT = 1FT), rather than headcounts; BC and Alberta, who have way more part-time students than anyone else, would look a bit worse if we did this using headcounts only. Finally, although I am expressing everything in terms of institutional income, since income and expenditure are pretty much identical, you can assume that everything I say here for per-student income is basically true for per-student expenditure, as well.
Got that? OK, off we go.
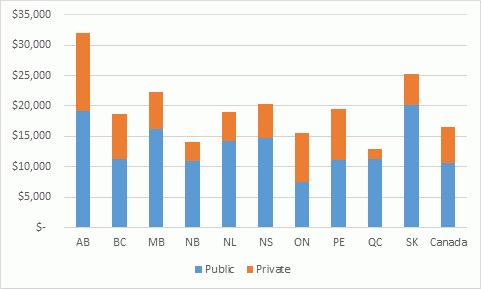
Figure 1 shows what income per head looks like in the college sector. Nationally, colleges receive $16,585 per FTE student per year, just under two-thirds of which come from government. Most provinces have averages above this, but Ontario and Quebec (which between them have almost 75% of the country’s college students) spends less. The surprise here is Alberta: despite receiving slightly less than the national average as a percentage of GDP, on a per-student basis its colleges and institutions receive a fairly outlandish $32,000 per FTE, of which about $19,000 comes from government.
Figure 1: College Income per FTE Student by Source and Province, 2011-12
Now, let’s turn to universities. On average, Canadian universities have income of $31,000 per FTE, which is ahead of pretty much any university system in the world, with the exception of US privates. Most provinces are pretty close to that level: only Manitoba is substantially below $30,000 per student, and only Saskatchewan, and Newfoundland are substantially above it. In most provinces, universities get about 60% of their total income from government; the exceptions are Ontario and Nova Scotia (where it is about 45%), Newfoundland (73%), and Quebec (66%).
Figure 2: University Income per FTE Student by Source and Province, 2011-12
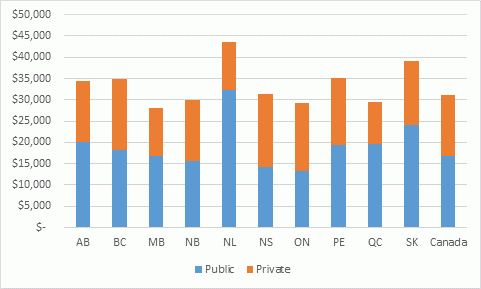
If this doesn’t look like what you’re used to seeing (e.g. Quebec universities don’t seem underfunded compared to Ontario universities), it’s partly because we’re not strictly looking at operating funding here: research funding from the federal government is also included, and that can change the lens a little bit.
Another truth here: the highest levels of funding are in Newfoundland and Saskatchewan. While Memorial, Saskatchewan and Regina are all decent universities, none of them tend to make anyone’s top ten list of Canadian institutions. Reasonable people might therefore question the strength of the link between per-student funding and quality.
Combine figures 1 and 2 and you get Figure 3, which shows average income across all post-secondary institutions per FTE.
Figure 3: Institutional Income per FTE Student by Source and Province, Colleges, 2011-12
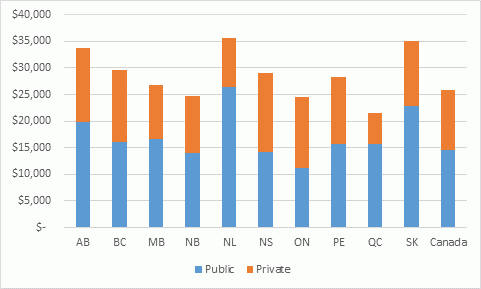
Now, Quebec goes to the bottom of the pile, but that’s mostly because of weak funding in the college sector (which is fair enough, because much of it is effectively the final year of high school). The biggest winners are – surprise, surprise – the three oil provinces of Newfoundland, Saskatchewan, and Alberta, all of whom are see institutional income of $35,000 per FTE student or thereabouts, which is roughly 35% higher than the national average of $25,800 per student.
It’s a very different picture than the one we saw yesterday when looking at expenditures as a percentage of GDP. Essentially, rich provinces don’t need to spend as much of their income on higher education to have good post-secondary education. As noted yesterday, Nova Scotia universities receive 2.5 times as much, in % of GDP terms, as do Alberta universities; yet, due to differences in provincial GDP and enrolments, Alberta institutions actually receive more dollars per FTE.
So which is the better measure, dollars per student or % of GDP? It kind of depends on one’s perspective. Institutions, naturally, care about the dollars: if someone else has more, they want parity so they can compete. But governments and citizens probably care more about % of GDP, which is a measure of society’s ability to pay for things. Every percentage of GDP used by PSE is a percentage that can’t be used to pay for something else, be it roads, hospitals, or personal consumption.
In other words, you can make a decent case for pretty much any province to be among the country’s best or worst, depending on whether you use a GDP framework or a per-FTE framework. This is intensely annoying to people who crave certainty and exactitude, but that’s the way it is.
 Tweet this post

To add to what I posted yesterday, which is that transfers give PEI a fiscal capacity out of proportion to GDP, a second factor in PEI looking like a high spender is that we have the Atlantic Veterinary College, co- funded by the other Atlantic provinces, as a huge add on to the university. It substantially increases spending but only handles a few hundred students. Warps our Macleans ranking numbers as well.
Good point re: AVC. Should have mentioned that.
This is very helpful information, Alex. Thank you for posting it!
What’s the primary data source (just for my records)?
Hi Nick. For universities I’m using income data from FIUC/CAUBO. For colleges I’m using FINCOL.