

Businesses have a pretty good way of knowing when to offer more or less of a good. It’s encapsulated in the equation MC = MR, and shown in the graphic below.
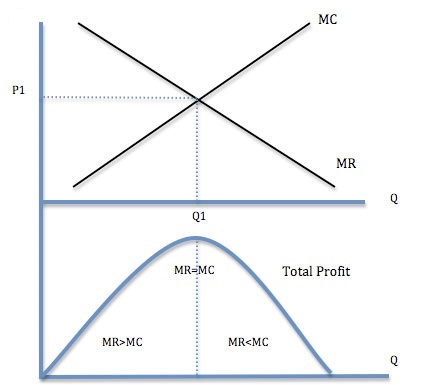
Briefly, in the production of any good, unit-costs fall to start with as the benefits of economies of scale start to rise. Eventually, however, if production is expanded far enough you get diseconomies of scale, and the marginal cost begins to rise. Where the marginal cost of producing one more unit of a good rises above the marginal revenue one receives from selling it (in the above diagram, Q1), that’s the point where you start losing money, and hence where you stop producing the good.
(This gets more complicated for products like software or apps where the marginal cost of production is pretty close to zero, but we’ll leave that aside for the moment.)
Anyway, when it comes to delivering educational programs, you’d ideally like to think you’re not doing so at a loss (otherwise, you eventually have a bit of a problem paying employees). You want each program to more or less, over time, come close to paying for itself. It’s not the end of the world if they don’t, cross-subsidization of programs is a kind of core function of a university after all; but it would be nice if they did. In other words, you really want each program to have a production function where the condition MC=MR is fulfilled.
But here’s the problem. Marginal revenue’s relatively easy to understand: it’s pretty close to average revenue, after all, though it gets a bit more complicated in places where government grants are not provided on a formula basis, and there’s some trickiness when you start calculating domestic fees vs. international fees, etc. But the number of universities that genuinely understand marginal cost at a program level is pretty small.
Marginal costs in universities are a bit lumpy. Let’s say you have a class of twenty-five students and a professor already paid to teach it. The marginal cost of the twenty-sixth student is essentially zero – so grab that student! Free money! Maybe the twenty-seventh student, too. But after awhile, costs do start to build. Maybe on the 30th student there’s a collective bargaining provision that says the professor gets a TA, or assistance in marking. Whoops! Big spike in marginal costs. Then where you get to forty, the class overfills and you need to split the course into two, get a new classroom, and a new instructor, too. The marginal cost of that forty-first student is astronomical. But the forty-second is once again almost costless. And so on, and so on.
Now obviously, no one should measure marginal costs quite this way; in practice, it would make more sense to work out averages across a large numbers of classes, and work to a rule of thumb at the level of a department or a faculty. The problem is very few universities even do that (my impression is that some colleges have a somewhat better record here, but the situation varies widely). Partly, it’s because of a legitimate difficulty in understanding direct and indirect costs: how should things like light, heat, and the costs of student services, admissions, etc., be apportioned – and then there is the incredible annoyance of working out how to deal with things like cross-listed courses. But mostly, I would argue, it’s because no one wants to know these numbers. No one wants to make decisions based on the truth. Easier to make decisions in the dark, and when something goes wrong, blame it on the Dean (or the Provost, or whoever).
Institutions that do not understand their own production functions are unlikely to be making optimal decisions about either admissions or hiring. In an age of slow revenue growth, more institutions need to get a grip on these numbers, and use them in their planning.
 Tweet this post

Glad to see some economic analysis here! A few thoughts:
I don’t think marginal revenue is always so close to average revenue. If the university is non-selective, then the only way to attract more students might be through lowering tuition fees such that MR might be quite a bit below price, or even negative. Seeking more students might be a losing proposition even at fairly low MC. For selective universities, where there are more qualified individuals willing to pay the going tuition rate than you are willing to accept, then yes MR is close to AR.
But a bigger issue is that I don’t think we can treat marginal costs as independent of revenues. Universities are nonprofits, and so additional revenues by some means or another become costs. Imagine a model where the university seeks all the revenue it can. It will somehow be spent. Ohio State doesn’t spend more than $100 million per year on athletic programs because that’s how much it costs to run athletic programs. It spends that much *because it can*. For any college, big or small, rich or poor, the costs of educating an additional student are a function of how much the school thinks it can spend. Marginal costs are not exogenous.
An old blog post of mine: http://www.artsjournal.com/worth/2014/04/nonprofit-costs-are-driven-by-revenues/
Hi Alex,
Sorry coming in a bit late on this one. I follow your blog and tweets and this one is directly related to what we do and I missed it! Anyway, it’s true that a lot of universities don’t fully understand their detailed costs and revenues. We don’t work with averages in our models, we use detailed transactional data from a range of source systems including finance, HR, Payroll, Facilities, Student Management, Timetabling etc to build up a holistic view of the university including all the direct and indirect/overhead costs covering all outputs including teaching, research, sports, community service and also all of the associated revenue. The underlying methodology is Activity-Based Costing, although it’s had a bit of a bad reputation because of failed implementations due to the difficulty of building and maintaining these models. We started building these models back in the mid 90s for military organizations in Australia and then the US and yes these models were large, complex, took forever to build and were painful to update. This was back in the old days of clipboards and interviews, but things are different now. There is a substantial amount of data available today and these models can be built relatively quickly, cover the entire university, are enduring models (not one time build), built with automated drivers (no need to manually update hundreds or thousands of items) which all means the models can adapt and evolve as the university changes and the models can be built once but used for many different purposes. Throw in any/all performance data on teaching and/or research and you start to get quite a powerful analysis tool. Take it one step further and build a predictive model based on multiple annual ABC models, then this adds a whole extra level of sophisticated analysis senior leaders can undertake. The other thing we have started is to do is explore benchmarks. Being able to decouple teaching from research we are able to compare, for the first time, like for like metrics at quite a detailed level. In summary it is happening, unfortunately it’s been at a glacial pace to date. There is a new book about to be published in a few weeks from Professor Bill Massy https://jhupbooks.press.jhu.edu/content/reengineering-university which provides a nice introduction to these types of models and the benefits of them.
Cheers,
Lea Patterson
CEO
Pilbara Group
Thank you for the informative article, I have read an interesting article about the same topic ‘Marginal Revenue and Marginal Cost’ and thought of sharing it https://www.haconsultancies.com/marginal-profit-vs-marginal-cost/.