

A couple of weeks ago I came across a story in the Vancouver Sun quoting a Federation of Post-Secondary Educators of BC (FPSE) “report” (actually more of a backgrounder) which contained two eye-catching claims:
- “per-student operating grants have declined by 20 per cent since 2001 when adjusted for inflation.”
- “government revenues from tuition fees have increased by almost 400 per cent since 2001”
The subtext here is clear. 20% down vs. 400% up? How heinous! How awful can the Government of British Columbia be?
Well now. What to make of this dog’s breakfast?
Let’s start with the second point. First of all, it’s institutional income, and not government income. But leaving that aside, there was indeed a very big rise in tuition fees back in 2001-2 and 2002-3 (presumably why the authors chose 2001 as a base…if one used 2003 as a base, it would be a very different and much less dramatic story). But if you simply look at average university tuition (college tuition is untracked) the increase since 2001 is only 110% (in nominal dollars). Assume the increase for colleges was a bit higher because they were working from a lower base and perhaps we can nudge that up to 125%. Still: how does one get from there to 400%?
First, remember that the authors (whoever they may be) are talking about aggregate tuition, not average tuition. So some of this simply reflects an increase in enrollments. In 2001-2, there were 196,000 students in BC. In 2013-14, the last year for which we currently have data, there were 277,515 – an increase of 41%. Back of the envelope, multiply that by the 110% nominal tuition increase and that gets you to a 176%. Still a ways to go to 400% though.
Second, a lot of students are moving from lower-cost programs to higher cost-programs. Some of that is happening within universities (e.g., from Arts to Engineering), but in BC it’s mostly a function of colleges turning themselves into universities and charging more tuition. University enrollment rose from 80,388 to 179,917 while college enrolments went from 116,007 to 197,698. That’s a lot of extra fees.
Third, BC has a lot more international students than it used to, and they pay more in fees on an individual basis than domestic students do. Add those two factors together and you get another 19% or so increase in aggregate fees, which brings us to a 210% total increase.
That’s still nowhere near 400%. So, I went and checked the source data – Statistics Canada’s Financial Information of Universities and Colleges (FIUC) for Universities (cansim 477-0058 if you’re a nerd) and the Financial Information of Community Colleges and Vocational Schools (cansim 477-0060) to try to find an answer. Here’s what I found:
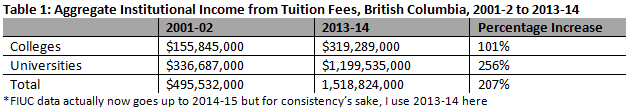
Yeah, so actually not 400%, more like 207% – reasonably close to the 210% from our back-of-the-envelope exercise. The best excuse I can come up with for the Federation of BC Post-Secondary Educators’ number is that if you extend the universities number out another year (to 2014-15), you get to $1.258B, which is almost four times (actually 3.74x) of the 2001-02 figure (which is still only a 274% increase). But you have to a) torque the living daylights out of the numbers and b) actively confuse percentage increases and multiples to get there.
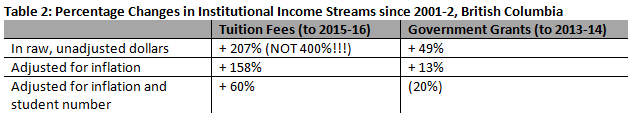
But now let’s move over to the other side of the ledger, where the Federation notes a 20% drop in government support per student, adjusted for inflation. Let’s note straight off the first inconsistency: they’re adjusting the government grants for inflation and not doing the same for tuition. Second inconsistency: they’re adjusting the government grants for the size of the student population and not doing the same for tuition.
It’s easy to see why FPSE does this. As we’ve already noted, student numbers were up by 41% between 2001-2 and 2013-14. Just do the math: a 20% per student cut while student numbers are rising by 41% actually means that government support has risen by 13%. In real dollars. (I went back to the source data myself and came up with 14% – Close enough). Chew on that for a second: FPSE is ragging on a government which has increased funding for post-secondary education by – on average – 1% over and above inflation every year since 2001-2.
So quite apart from any problems with the 400% number, FPSE is making a deliberate apples-to-oranges comparison by adjusting only one set of figures for student growth and inflation. Here’s how those numbers compare on a number of different apples-to-apples basis (and I’m being nice to FPSE here and allowing different end dates for fees and grants based on different data availability):
Now, it seems to me there’s enough in the Clark government’s record to mount a decent attack without resorting this kind of nonsense. It certainly under-invests relative to what it could be doing given the province’s growing population. It carries a faux-populist pro-extraction industry line to the detriment of investing in expanding knowledge industries. It has stayed out of step with most of the rest of the country in the last ten years by not improving student assistance. And a fair, non-torqued comparison between student fees and government grants still shows students are bearing an increasing share of the cost.
So why stoop to using transparently false figures? One might expect that kind of chicanery from the Canadian Federation of Students, which has form in this area. But this is from an organization which represents professors: people who actually use statistics in the search for the truth. So why is the organization which represents them using statistics in a way that wouldn’t pass muster in an undergraduate course?
I’m quite sure most profs wouldn’t be OK with this. So why do FPSE’s member locals tolerate it?
 Tweet this post

The BC fPSE represents the two-year colleges and miscellany. Some of those colleges were declared “Universities“ by Premier Gordon Campbell,
(I wouldn`t say that his sister was an administrator of Capilano College, North Vancouver had anything to do with it. 😉 See also Vancouver Island “University“ (Nanaimo), Emily Carr “University“ of Art + Design IVancouver), Thompson Rivers “University“ (Kamloops) and others)
See https://en.wikipedia.org/wiki/Higher_education_in_British_Columbia#Creation_of_teaching_universities_.282008_-_present.29 for some more details.
Of course they get it wrong, they are concentrating on the trade schools level with the typical BC Liberals“s inflated titles.
Quote from their fpse.ca/about webpage “The Federation of Post-Secondary Educators of BC is the provincial voice for faculty and staff in BC universities, colleges and institutes, and in private sector institutions. FPSE member locals, represented by President’s Council and the Executive, represent over 10,000 faculty and staff and was formerly the College Institute Educators’ Association of BC.“