

As the school year starts, it’s always valuable to take a look at trends in incoming students. The best tool we have for that in Canada for doing this is the Canadian Undergraduate Survey Consortium’s triennial survey of first-year students (the most recent version is here. It’s not the greatest of instruments: consortium membership changes from cycle to cycle, so the base population is neither equal to the national first-year population nor stable from cycle to cycle. But since Statistics Canada is now declining to do any surveys at all of enrolled students, it’s all we’ve got, and by and large, participating institutions are reasonably representative of the country as a whole. There’s also a problem with CUSC occasionally changing the wording of the questions, thus making time series somewhat difficult – but then again, this is an aggravating habit that Statscan has in spades. So, with all those difficulties acknowledged, let’s begin.
Here’s my favourite chart, on the theme of visible minorities (a subject I tackled a few months ago):
Figure 1: Visible Minority Students as a Share of all First-year students, 2001-2016
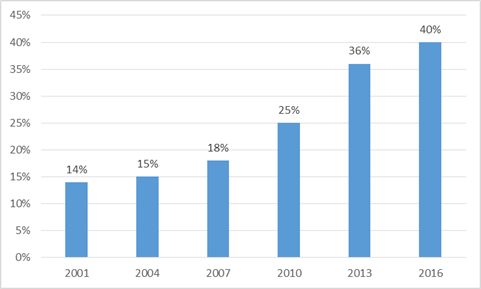
Now part of the increase comes from the way this value is calculated. The question used to simply be: “are you a visible minority?”’; it now asks directly about ethnicity and infers visible minority status on that basis (basically, if you do not declare yourself as white or aboriginal, you are considered “visible minority”). So part of the increase may have to do with a change in the question phrasing. But still, this is pretty impressive. Even if you take out all the international students (not all of whom are visible minority), you’re talking 33% of all students (compared to just 22% of all Canadians 15-24%) being visible minority. That would make Canada possibly the only country in the world where visible minorities have that kind of advantage.
Here’s another intriguing time series where the phrasing of the question makes an enormous difference: students with disabilities.
Figure 2: Percentage of Students Indicating they Have a Disability, 2001-2016
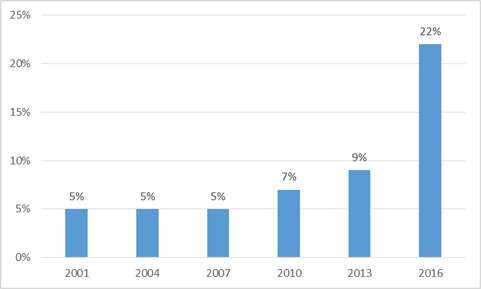
The jump in the last three years is definitely due to the way the question was posed. In all previous years, the question was “do you have a disability”? In 2016, the question specifically referenced nine different kinds of disability (including learning disability, which accounted for over half the responses). It then asked if the disability was serious enough to require the university to provide accommodation. Only 32% of those listing disabilities – or 7% of all students – said yes, which brings us back down to the range of previous years. Moral: how you ask a question matters a lot.
On to socio-economic background, which this survey measures via parents’ educational background. This time series is a bit messed up because CUSC changed the wording of the question this year (formerly, the survey asked about each parent separately, now it just asks about “parents’” highest level). But here goes:
Figure 3: Percentage of Students’ Parents Possessing a Bachelor’s Degree or Higher

It’s hard to know exactly what to make of these results. Since children tend to hit university about 30 years after their parents do, this graph is to some extent just reflecting the expansion of access to university in the 70s and 80s. But that’s not quite the whole story. According to the census, in 2001, 17% of adults aged 45-64 possessed a bachelor’s degree or higher; in 2011 it was 21% (I know, I know, National Household Survey – but still). So it appears as if more recent cohorts of first year students are slightly more likely to come from better-educated households than their predecessors, which is not a particularly good finding.
More tomorrow.
 Tweet this post

I would be interested in your thoughts on the implications of the stats on Indigenous students.