

Every year or two, it’s fun to play with Ontario applications data (it would be fun to play with applications data from the rest of the country, too, but Ontario is the only place that actually aggregates it, so hold your hot-takes on upper-Canada-centricness). And, it turns out, there are a lot of quite interesting stories.
Let’s start with the programs of study. The Ontario University Applications Centre modified its program categories a couple of years ago, so to look at long trends on a consistent basis, you need to merge some fields into larger-super fields. In figure 1, all the science, math and engineering fields are combined into “STEM”, and all the humanities, language, social science and journalism field are combined into a single “Arts/Journalism” category. As you can easily see, the Arts/Journalism category took about a 20% hit between 2011 and 2018, while all the other fields rose (from considerably smaller bases) by 20-30% over the same period.
Figure 1: Applications by Broad Field of Study, Ontario, 2005-2019
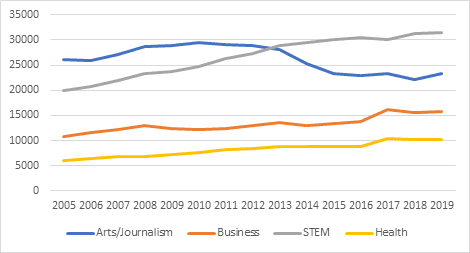
That’s the long-term picture, and you’ve heard it before. But zoom in on what’s happened during the last year and it seems like there might be something interesting happening: namely, a fading of the Engineering tide and a bit of a resurgence in the humanities, where applications are up by almost 8%.
Figure 2: Change in Applicants by Program Area, Ontario 2018 to 2019
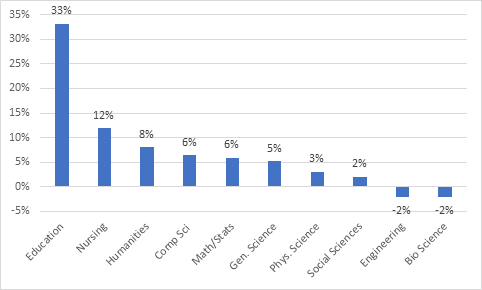
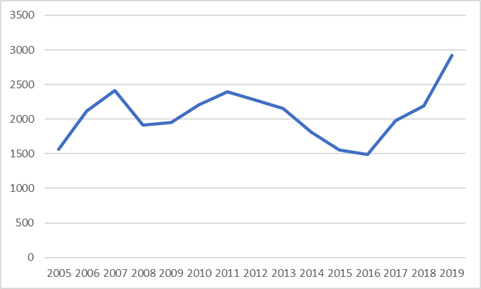
Of course, the real shocker in figure 2 is applications to Education. Doesn’t everyone know there is a glut of teachers? Well, in fact, that doesn’t seem to be true any more: as the good folks at University Affairs pointed out a couple of months ago, labour markets for teachers have tightened, and last year new graduates and projected vacancies in Ontario were pretty much equal (plus there is a big sucking sound to the west as BC moves to fulfill a Supreme Court ruling on reducing class sizes). Students responded to this labour market signal by flooding into programs – applications last year were an all-time high (unfortunately the applications deadline fell a couple of weeks before the Ford government announced its plans to cut education funding and hence restrict the intake of new teachers).
Figure 3: Applicants to Ontario Undergraduate Education Programs, 2005-2019
But hey, let’s not focus just on fields of study: there’s also the question of which institutions students wish to attend. And this, I think, is pretty interesting. Figure 4 shows change in applications by institution between 2009 and 2019. System-wide, the number of applications is up 8%, and most institutions are within spitting distance of that number, but there are also some huge outliers at the top and bottom.
Figure 4: Change in Applicants to Ontario Universities, by Institution, 2009-2019
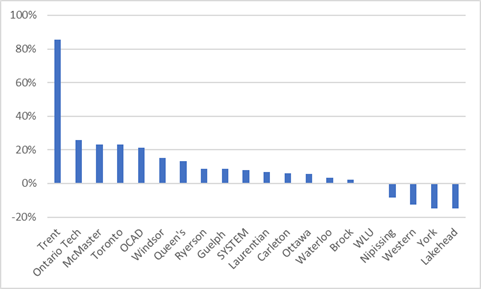
Let’s start at the bottom, where the two institutions with the biggest drops in applications are York and Lakehead, both of which saw drops of 15%. York’s drop is almost certainly due entirely to one specific union local (CUPE 3093) and its ongoing mission to kneecap the institution through long, bitter, repeated strikes. Lakehead’s fall might be attributed to a sharp decline in the local population, though it’s worth pointing out that Laurentian and Windsor have seen falls in local populations of similar magnitude yet managed increases in domestic applications. The really interesting one, though, is Western, which has seen numbers drop by 12%. What’s the story there? I can only speculate, but perhaps a) students aren’t as attracted as they used to be by early 00s notions of “engaged universities”, b) party schools aren’t a thing anymore, or c) parents notice when the most prominent book published by a university’s faculty is about how faculty should work less. Speculation from readers on this point is always welcome.
But let’s also look at the successes. And goodness, Trent. An 85% increase in applications. No, that’s not a misprint and no, I have idea what is going on there, but good on them. Similarly, a 21% increase at OCAD is certainly not in keeping with the common refrain of “why are kids all leaving the arts for STEM fields?” McMaster and Ontario are probably easier to parse, but Ontario Tech (formerly UOIT, they rebranded last month) is hard to read: is this a reflection of greater demand for engineers, or is it a reflection of the fact that Ontario Tech is just a better-known institution now than it was in 2009 (when it had only had a couple of classes of graduates)? Hard to say.
In sum: demography is not destiny and never rest on your laurels: if students and parents think you aren’t responding to changing interests quickly enough, they will make you pay.
Errata: We incorrectly identified the authors of the “The Slow Professor” as a Western based faculty member. We regret the error.
 Tweet this post

Your linked posting on ‘The Slow Professor’ (title of my memoirs just stolen from under me, right there) says, “a book by Maggie Berg and Barbara Seeber – English professors from Brock and Queen’s, respectively,” but the text of this post seems to suggest they are Western faculty.
Thanks for the interesting comparisons. The one confounding factor is that an increase in “applications” is not quite the same as an increase in “applicants”. The trend over the past decade or more has been for individual applicants to submit ever increasing numbers of applications. You can roughly see this in the OUAC Form 101 data, comparing the total number of applications to the total number of confirmations in September, which is around 6.3 applications/confirmation in 2018, versus about 5.7 in 2009. I suspect that some growth is simply people hedging their bets with applications to perceived “backup” schools and programs.
Right. But the data there is first-choice applications only, so there is no double-counting
OK good, thanks for clarifying.
I wonder if the drop in engineering applications is at least a factor in the Western decline, alongside the other factors you noted? I understand that here at Waterloo our weak growth noted above is largely related to drops in applications to the Faculty of Engineering.
As the parent of a student who has applied to universities this year I had already been looking at the OUAC numbers. It’s interesting to see that many of the changes in the year over year numbers reflect the longer term trends you have outlined but there are few other ones as well. Applications are significantly up at: Algoma (27.4), Nipissing (20.8), OCAD (18.7), Brock (15.8), Laurentian (14.5), Queen’s (14.1), Trent (13.3), and Windsor (10.2).
The increases to Brock, Trent, & Queen’s may be partly explained by the increases in applications to Education programs. Also while applications to Western Main campus are down again slightly (-0.9), applications to 2 of it’s affiliated campuses, Huron and Kings, are up significantly (27.2 & 32.1).
On the losing side are York (-12.5) and Waterloo (-7.2) as you have mentioned, but this year Wilfrid Laurier is also a loser (-12.0), no doubt as a result of the kerfuffle last year with TA Lindsay Shepherd. I agree that the decrease at York is a result of the strike last year. The downturn at Waterloo seems much greater than just as a result of the decrease in applications to Engineering. I suspect that outside of Engineering/Comp Sci/Math, other students are being turned off by Waterloo’s reputation as the school where “fun goes to die”.
It almost seems like there maybe a shift towards smaller undergraduate focused schools over the larger research intensive schools. Also the swing away from STEM towards Arts/SS/Humanities may also account for the uptick in applications to these schools. While my son is applying to STEM programs (Physical Sciences) he had no interest in attending U of T or Western. His top choices are McMaster and Queen’s.