

The Canadian Association of Research Libraries (CARL) recently issued its annual statistical report. I thought I’d take the opportunity over the next couple of days to take a look at a few interesting patterns in library practices and expenditures. They shed some interesting light on the pressures Canadian academic libraries face right now.
Some methodology here: CARL has 29 university members, from the very large U of T (almost 74,000 FTE students) to UNB (under 8,000 FTE students). As a result, expressing figures in terms of “average per institution) (as CARL does) is kind of weird. So I have chosen to display all institutional values on a “per student” basis. This has some problems of its own (libraries don’t just service students, not all students use libraries with same intensity, etc.) but they are less severe than doing it on a per-institution basis.
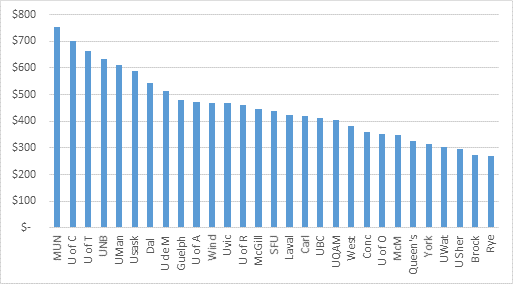
Let’s start with Library expenditures. A little over half (55%) of library expenditures go towards salaries and benefits. On average, across all institutions, CARL universities spend $432/student per year on this, but the range is enormous. At the top end Memorial and Calgary were spending over $700/student, but at Sherbrooke, Brock and Ryerson the amount was under $300 per student.
Figure 1: Per Student Expenditures on Salary & Benefits, Canadian Research University Libraries, 2014-15
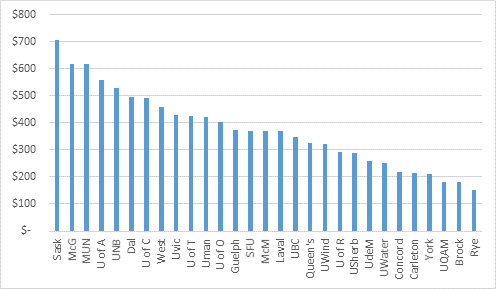
Most of the rest of the library budget goes on “materials”, which is predominantly the acquisition of titles and periodicals. Across CARL institutions, the average expenditure on this item is $365/student per year, but again there is huge variation around the mean. McGill and Memorial both spend over $600/student; Saskatchewan spends over $700/student. At the other end, Ryerson, UQAM and Brock are all under $200 per student.
Figure 2: Per Student Expenditures on Library Materials, Canadian Research University Libraries, 2014-15
As you can see, some universities end up towards the top of both lists (mainly those in provinces with a lot of natural resource revenues), and some end up towards the bottom (mainly those universities which aren’t actually all that research-intensive). But the interesting thing to me is the relationship between those two graphs: what’s the ratio of spending on staff to spending on materials? Well, nationally, CARL members spend just under 85 cents on materials for every $ spent on salaries. Again, there’s quite a bit of variation.
Figure 3: Ratio of Expenditures on Library Materials to Library Staffing Costs, Canadian Research University Libraries, 2014-15
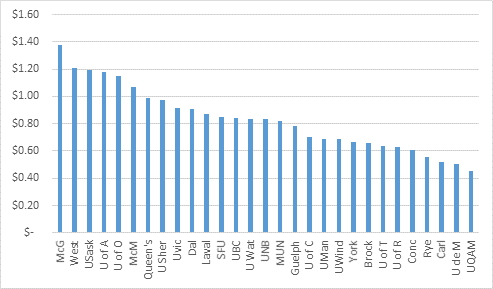
At one end, you have McGill, which spends $1.38 in materials for every dollar they spend on staffing, which suggests either that they are a lean machine or that their collection specializes in some ludicrously expensive journals (it’s probably not a coincidence that all the institutions at the left hand side of the graph have medical schools). At the other end, curiously, you have the two francophone Quebec universities where the spending ratio is extremely low: 50 cents on materials for every dollar in staffing at Université de Montréal and 48 cents at UQAM.
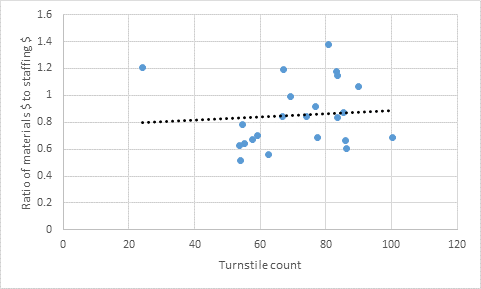
Might these differences in some ways be related to utilization rates? One crude way of looking at usage is to look at turnstile counts, which are tracked at 23 of the CARL institutions. Measured on a per-student basis, one again sees massive differences, the average across the country is 70 turns per student per year, but it ranges at the top end with Saskatchewan recording 100 turns per student per year to Laval, which only gets 24. One might expect that universities with higher turnstile counts might need a slightly higher staffing count to deal with more users. But in fact the relationship between the two is essentially non-existent.
Figure 4: Turnstile Counts vs. Materials:Staff Ratio, Canadian Research University Libraries, 2014-15
That leaves us with a bit of a puzzle as far as why we see such different cost patterns at different universities. There are presumably some relevant structural and historical reasons why you get this kind of spread: different universities need of different library services, costs may be elevated because of specialized holdings; for instance, MUN manages a Centre for the Study of Newfoundland which is undoubtedly costly and would likely elevate staff costs considerably). So, one shouldn’t leap to conclusions about the efficiency of any particular library based on this kind of comparison; but at the same time this kind of data does allow us to ask much better questions about why each university’s library cost structure looks the way it does.
Not that Libraries have that much to answer for in this respect. As we’ll see tomorrow when we look at trends over time, libraries have been able to contain their costs far better than the universities to which they belong.
 Tweet this post

It is fair to simply say ‘expenditures per student’? A smaller school would, in theory at least, be paying more per person simply to stock the basics while this would be further diluted in a larger school.
I notice that the two universities that have the highest staffing to materials budget ratio are both francophone universities, and one, Universite de Montreal, has implemented a particular collections model that has eschewed the “big deals” (see for example this press release by UdeM libraries: http://www.bib.umontreal.ca/communiques/20160506-DC-annulation-springer-va.htm) In making this decision to cancel deals, the library is essentially requiring in-house librarians to make collections decisions on a local scale and have library support staff available to process interlibrary loans, both of which are going to require more staff. Also, demand is likely to be lower at these institutions on account of the language barrier. While the average PhD student at a francophone university likely can read english at the same level as a PhD student elsewhere, I’m not sure the same can be said for the undergraduates. At francophone universities, they may not be using journal articles to support their papers at the same rate as their anglophone counterparts because they are written at a language level that is inaccessible to them. And while researchers are the heaviest users at all universities, their shear numbers mean undergraduate students and their use of journals (or lack thereof) drives the bus!