

We haven’t looked at Faculty salary data in awhile. Time for a gander.
Let’s compare data from the years 2009-2010 and 2014-15: a nice round five years. The data for 2009-2010 is from the old Statistics Canada UCASS survey, discontinued but recently revived; the 2014-14 data is from the National Faculty Data Pool, an organization set up by Canadian Universities to keep the UCASS going after it was defunded. I have restricted the sample to the 38 institutions which appear in both datasets. A few institutions chose not to participate in the NFDP exercise, most significantly Montreal, Laval, Sherbrooke, UNBC, Winnipeg, Brandon, St. FX, Cape Breton and Mount Saint Vincent; Victoria is excluded because its data is not available from 2009-10. On the whole, these missing institutions tend to have lower salaries than other universities in Canada, and as a result, the national averages that arise from this exercise are going to be somewhat higher than a true national average. So, focus on the change over time (which is very accurate, for institutions accounting for over 80% of professors across the country) and not the averages.
Got that? OK, good. On to figure 1, which shows average change in professorial salaries by rank. For purposes of comparability, the 2009-10 data is shown in 2014-equivalent dollars.
Figure 1: Average Canadian Professorial Salaries by Rank, 2009-10 and 2014-15, in constant 2014 dollars
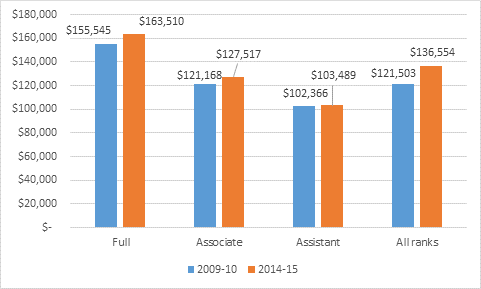
So, what we see here is that across all ranks, faculty salaries for tenured and tenure-track professors have increased faster than inflation since 2009-10. The increase was largest for both full and associate profs at just over 5%, while for assistant professors the figure is just 1.1%. However, the average rise in real salaries across all ranks is a whopping 12.4% over five years – or roughly 2.3% per year on top of inflation (for comparison: economy wide, average wage rates over the same four years rose by just 1.5% or 0.3% per year). How is this possible? Simple: the professoriate is aging, and a greater fraction of professors are now in the upper (and better-paid) ranks than was the case five years ago. Progression Through the Ranks makes a huge difference.
Now, let’s compare Canadian salaries to American ones, using the annual American Association of University Professors’ Annual Report on the Economic Status of the Profession for 2014-15. This is tricky for three reasons. The first is the problem of differing exchange rates; I deal with this by using 2014 Purchasing Power Parity value ($1C = $0.85 US). The second is that the US has a much wider variety of institutions which get included in their national statistics: at the top end there are a lot of very rich private universities and at the bottom there are a lot of institutions which are what we would call community colleges, neither of which are included in the Canadian data. To deal with this I chose to compare professors at public doctoral institution in the US only with professors at 13 research-intensive universities in Canada for which the National Faculty Data Pool has data (i.e. U-15 minus Montreal and Laval).
The third and trickiest issue is how to account for the fact that American salaries cover 9 months of work while Canadian ones are for 12, with Americans free to top up their salary by up to 2 months’ worth of their regular salary (2/9 = 22%) with money from research grants (these are sometime called “summer salary”. To show a range of possible comparators, I show 9-month US base salaries, 12-month salaries for those with summer salary, and a weighted average of the two, based on data from the National Research Council’s Assessment from Research-Doctorate Programs in the United States suggesting that 69% of academic staff at research institutions hold research grants. Note that no data exists as to how often grant money gets used from summer salary; for lack of data I assume here that everyone who receives a grant takes the maximum two months, which almost certainly results in an overestimate for US salaries, so caveat emptor, etc.
With that in mind, Figure 2 provides the comparison of salaries across professors at public research universities in Canada and the US.
Figure 2: Canadian vs. US Professorial Salaries at Public Doctoral/Research Universities by Rank, 2014-15, in Canadian $ at PPP.
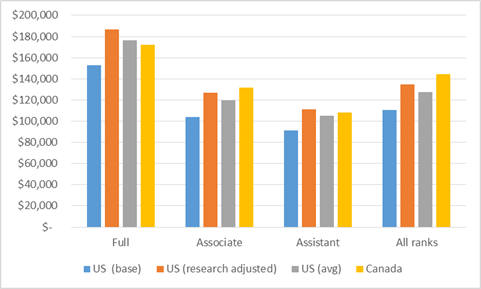
The quick conclusion from figure 2 is that base salaries in Canada are higher than those in the US, but that much of this goes away once research dollars are included, especially for full professors. However, across all ranks, Canadian professors at research universities not only have higher average salaries ($144,153) than American ones ($127,298), and that this result remains true even if we look only at American professors with research grants ($134,879).
Now on to figure 3 where we look at changes in salaries over the past five years. I’ve again restricted the comparison to research/doctoral universities, but for fun I’ve included US privates.
Figure 3: Real Change in Salaries, in Canadian at Public Doctoral/Research Universities by Rank, 2009-10 to 2014-15, Canada vs. US
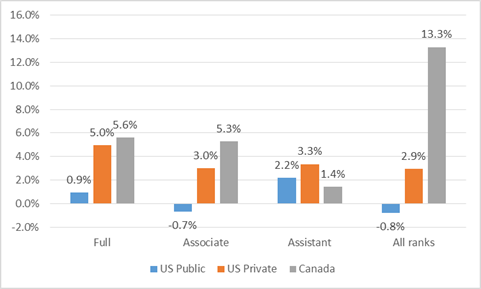
Across all ranks at doctoral/research universities, Canadian research university professors’ salaries rose 13.3% after inflation. For US privates, the equivalent was 2.9% and at US publics it was negative 0.8%. At each individual rank, the differences are smaller (and in fact at the assistant professor level, rises in Canadian salaries are smaller than in the US). Why the difference? Well, mainly, it’s that in the two countries we are seeing two completely different demographic shifts. In the US, a decreasing percentage of professors are of “full” status, whereas in Canada it is increasing. Their lower ranks are growing, ours are shrinking.
I would just remind everyone that these stonking increases in compensation are occurring at a period which the Canadian Association of University Teachers (CAUT) continues to refer to as one of “austerity”. I therefore propose that CAUT get on the phone to their counterparts in Greece and explain this fascinating model of austerity in which the average professor is receiving annual raises equal to 1.5 to 2.5% above inflation, year after year. I bet they’d really get a kick out of it.
 Tweet this post

1) if you are going to use PTR, which is what makes the first chart eye-popping, then I suspect the comparison with “average wage rates” is apples vs oranges. The “average” person represented in those PTR columns on the right is someone with 5 more years experience/seniority in 2014-15 than in 2009-10. This isn’t captured in “average wage rates” or the 3 columns on the left.
2) At least in my experience, discussions about “austerity” at Canadian universities are not primarily about salary. At my university, salary scales have been increasing at less than the inflation rate for the last half-dozen years or so. With PTR, most individuals’ salaries have probably gone up slightly more than inflation. It ain’t great, but for most it’s not “austere” either. On the other hand, the number of TT faculty on campus has declined by 15-20%. Your point about “shrinking” lower ranks seems to confirm this is not unique to one institution. We’re “top-heavy” because fewer replacements are being brought in at the bottom.
Hi Andrew. Thanks for writing.
Re: 1) But that’s my point. the point is an aging professoriate has consequences. PTR makes sense *if* average age stays roughly constant with regular retirements and offsetting hire of junior staff. and re: pt 2) I think you have it backwards – replacements are not being brought in precisely because depts are top-heavy and older profs not leaving.
On point 2, Alex is absolutely correct. There is a bit more context as to why this is the case, and a challenge for how to implement a policy for faculty renewal. Bracketing out those senior faculty who stay on out of preference alone, those universities that operate using DC-style pensions has meant some senior faculty may have lost a chunk of pension cash after the 2008 downturn and so stay on to make up for the losses. What is interesting (and maybe scary) is that there may be a little of a pinch-point in ranks: a large salary mass of senior faculty staying on, and a large pool of sessionals, with not as many early or mid-career faculty. Labour supply is not an issue here, but the unevenness of the spread. And, since so many academic units are not permitted to run deficits, it’s not as easy as creating a whole whack of TT positions while also shouldering the salary costs of senior faculty. This may be particularly acute in non-STEM disciplines.
It may be the case that some faculty associations are not seeing the bigger picture here. I’m not going to use hyperbole in saying there is a “crisis,” but there is a mounting concern on the lopsidedness of the ranks in terms of proportion. Perhaps admins who have a longer view might think of being more aggressive in using buyout options to free up some costs, but the upfront costs of that can be fairly prohibitive and take years to recoup. Is there a better solution?
I liken the situation to a factory where you have an enormous pool of apprentices (some of them way beyond their apprenticeship time!), and a large mass of upper-end salaried workers, with a much thinner supply of mid-career folks. That seems a bit unstable. In terms of uni strategic plans, you don’t see much attention given to this issue beyond a few motherhood statements of “we plan to attract the best and brightest” followed by no real tactical means to implement it. Any changes in the ranks population would most likely have to be gradual and incremental, but it seems that the current “policy” is to just “watchful waiting” in the hopes that it will resolve itself. Perhaps the time to have resolved this issue effectively was some while ago. We can’t (legally) just push senior faculty out the door and then open the gates to all the sessionals.
Perhaps the “compromise” to cushion the increasing costs is to rein in faculty salaries (perhaps even index them against inflation + CPI), but we all know that would simply outrage faculty associations.