

So just before I quit blogging in December, the Council of Ontario Universities released its annual survey of graduate outcomes, this time of the class of 2013. The release contained the usual platitudes: “future is bright”, “vast majority getting well-paying jobs”, etc etc. And I suppose if one looks at a single year’s results in isolation, one can make that case. But a look at longer-term trends suggests cause for concern.
These surveys began at the behest of the provincial government seventeen years ago. Every graduating cohort is surveyed twice: once six months after graduation and once two years after graduation. Students are asked questions about their employment status, their income and about the level of relationship between their job and their education. COU publishes only high-level aggregate data, so we don’t know about things like response rates, but the ministry seems pleased enough by data quality, so I assume it’s within industry standards.
Figure 1 shows employment rates of graduates six months and two years out. At the two-year check point, employment rates fell by four points in the immediate wake of the 2008-9 recession, (be careful in reading the chart: the x-axis is the graduating class, not the year of the survey, so the line turns down in 2006 because that’s the group that was surveyed in 2008). Since then it has recovered by a little more than a point and a half, though further recovery seems stalled. At the six-month point, things are much worse. Though employment rates at this point are no longer falling, they remain stubbornly seven percentage points below where they were pre-recession.
Figure 1: Employment Rates, Ontario University Graduates, 6 Months and 2 Years Out, by Graduating Class, 1996-2013
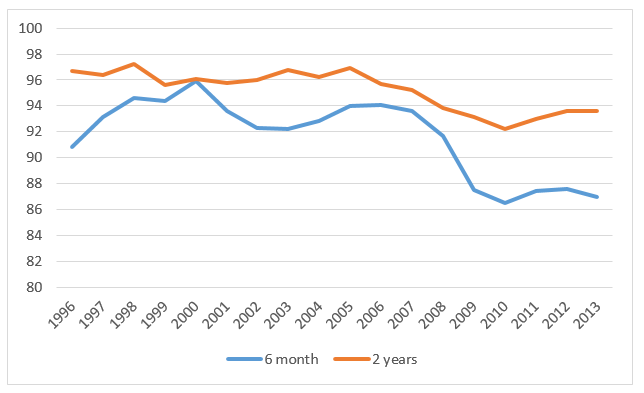
If you want to paint a good story here, it’s that employment rates at 2 years out are still within three percentage-points of their all-time peak, which isn’t terrible. But there doesn’t seem much doubt that students are on average taking a bit longer to “launch” than they used to; employment rates six months out seem to have hit a new, and permanently lower floor.
Now, take a look at what’s happening to starting salaries. As with the previous graph, I show results for at both the six-month and the two-year mark.
Figure 2: Average salaries, Ontario University Graduates, 6 Months and 2 Years Out, by Graduating Class, 1996-2013, in $2016
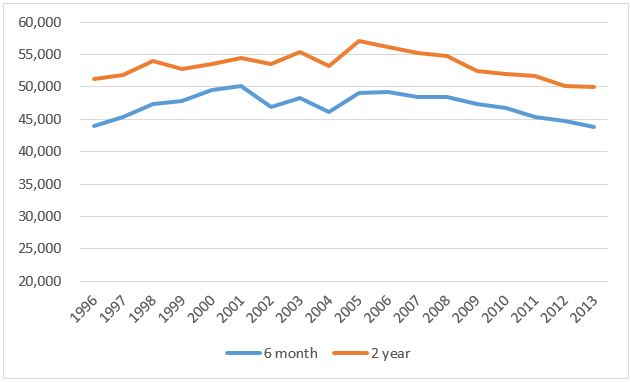
What we see in Figure 2 is the following: holding inflation constant, during the late 1990s, recent graduates saw their incomes grow at a reasonably rapid clip. For most of the 2000s, income was pretty steady for graduates two years out (less so six months out). But since the 2008 recession, incomes have been falling steadily for several years; unlike the situation with employment rates, we have yet to see a floor, let alone a bounceback. Real average incomes of the class of 2013 six months after graduation were 11% lower than those of the class of 2005 (the last fully pre-recession graduating class); at 2 years out the gap was 13%. Somehow these points did not make it into the COU release.
That, frankly, is not good. But it seems to me that we need to hold on a little bit before hitting panic buttons about universities being a bad deal, not being relevant to shifting labour market, etc, etc. Sure, the drop-off in both employment rates and incomes started around the time of the recession and so it’s easy to create a narrative around changed economy/new normal, etc etc. But there’s something else that probably playing a role, and that’s an increase in the supply of graduates.
Figure 3: Number of Undergraduate Degrees Awarded, Ontario, 1999-2013
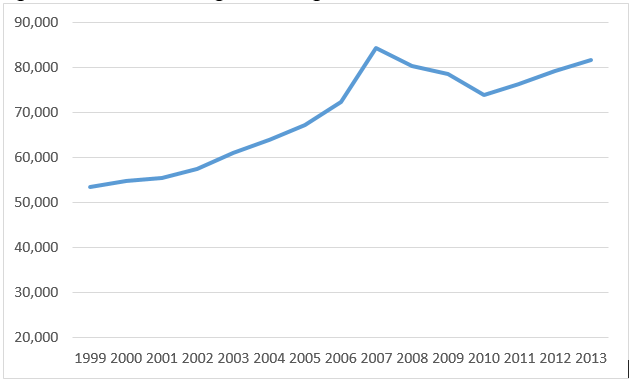
The other big event we need to control for here is the massive expansion of access to higher education. In 2003, the “double-cohort” arrived on campus and that forced government to expand institutional capacity, which did not subsequently shrink. Compared to the year 2000, the number of graduates has increased by over 50%; Such an expansion of supply must have had some effect on average outcomes. It’s not simply that there are more students competing for jobs – something one would naturally assume would place downward pressure on wages – but also, the average quality of graduates has probably dropped somewhat. Where once graduates represented the top 20% of a cohort in terms of academic ability, now they probably represent the top 30% or so. Assuming one’s marginal product in the labour market is at least loosely tied to academic ability, that would also predict a drop in average post-graduation incomes. To really get a sense of what if anything has changed in terms of how higher education affects individuals’ fortunes in the labour market, you’d want to measure not average income vs. average income, but 66th percentile of income now vs. 50th percentile of income fifteen years ago. Over to you, COU, since you could make the microdata public if you wanted to.
In short, don’t let institutions off the hook on this, but recognize that some of this was bound to happen anyway because of access trends.
More graduate income data fun tomorrow.
 Tweet this post

When looking at changes in percentages above 80%, I find it useful to think about fractions. A drop from about 96% to 94% in employment rates sounds like a small change, but if you look at it in terms of fractions, that’s going from about 1 in 25 students without work to 1 in 16. Similarly, for the 6-month unemployement data, the drop from 94% to 85% means that where 1 in 16 students used to be without work, now it’s more like 1 in 6.