

This is part 2 of a two-parter on how Canadian universities spend their money. All the stuff about what data I’m using, caveats thereto, etc., are available in yesterday’s post. If you missed yesterday, go catch up here.
First, two small mea culpas from yesterday. First, due to a cut/paste error, part of the data on student services that went out yesterday was slightly off, but has now been corrected on the website. Second, I neglected to mention that the student services figures included money from operating budgets for grants and bursaries, which accounts for some of the wide differences between institutions. Sorry.
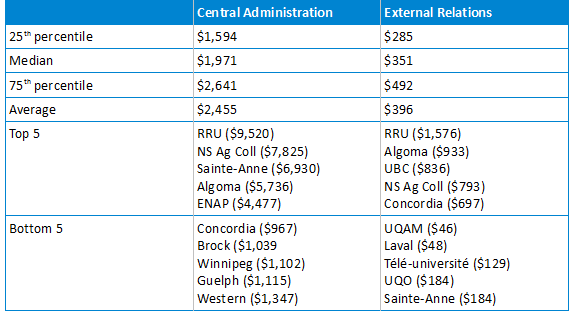
OK, onwards. Let’s focus first on the two spending categories we didn’t take a look at yesterday; namely, “Administration” (meaning, mostly, central administration) and “External Relations” (meaning mostly government relations and fund raising). This is shown below in table 1.
Table 1: Per-Student Expenditure, Selected Categories of Non-Academic Activity
A couple of obvious points here:
- Compared to the spending categories we looked at yesterday, the gaps between 75th and 25th percentile are smaller (in other areas, the gap was usually 2:1; in these categories it is closer to 3:2). This suggests that on the whole, institutional spending patterns vary less in these central admin functions that they do in areas like libraries and ICT.
- On the other hand, the institutions at the top and bottom of the range seem to be much more outliers. At the high-cost end, there are probably two things going on. First, some tasks are pretty common and have to be done no matter what the size of the university, so small institutions tend to look expensive on a per-student basis (for example: a $400,000 p.a President at a school with 40,000 students is $10/student; a $200,000 p.a President at a university with 2,000 students is $100/student). Second, recall that the “central administration” category does vary a bit from school-to-school, and so some of this may be about oddities in reporting.
- Most of the schools that spend small on “external relations” are part of the UQ system. Basically, when you’re so close to being 100% government-funded and controlled, you don’t lobby or look for external money, hence your costs go down.
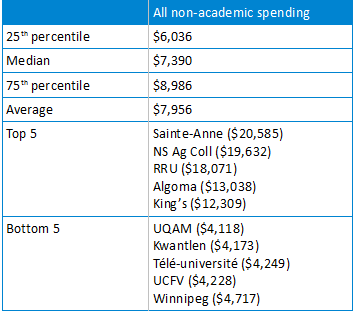
Figure 2 puts together all the data from the different expenditure categories.
Table 2: Per-Student Expenditure, all non-academic categories
Three major points here:
- The per-student costs at very small universities is really stratospheric. Universities clearly have some fixed base costs that require large student numbers in order to make them bearable. From a public policy perspective, that either makes it important to ensure institutions are a minimum size, or that funding formulas provide a base amount for fixed costs in addition to per-student funding.
- Keeping a rein on non-academic costs matters. The difference in costs between an institution at the 75th percentile of overall non-academic costs and a 25th percentile institution is $2,950 or pretty close to half a year’s worth of average tuition at a Canadian university. That’s a lot of money which could be used for other purposes (or cut in order to provide cheaper education, though that wouldn’t be my choice.
- Actually, it’s even more than that. If an institution could emulate the spending of the 25th percentile institution in each individual category – that is, a library cost like UQAM’s ($509/student), an ICT cost like Carleton’s ($508/student), physical plant costs like Laval’s ($1,331/student), Student Services costs like Winnipeg’s ($958/student), administration costs like St. Thomas’ ($1,604/student) and external relations’ costs like Manitoba’s ($285/student), you’d have total non-academic costs of just $5,195 – that is, $3,800 less than the 75th percentile institution and $2,200 less than the median one.
But of course, one might protest: does anyone really want to be in the 25th percentile of spending on this stuff? Don’t great universities spend a lot of money on this stuff? Isn’t spending more money on things like Libraries and ICTs a sign of quality?
Well, maybe. To some extent, you get what you pay for. But welcome to the central paradox of university management: you can’t simultaneously demand prudence and excellence if the only indicator of greatness is how much money you spend. It’s why outcome metrics matter; and why those who oppose them, in the end, simply promote waste.
 Tweet this post

Interesting….. I wonder about connections between funding lvels and internal frictions. At UBC (top 5 in External Relations Funding) there apparently were significant trust issues between the resigned preident and the communications/externall VP/staff.
Any chance you can publish full ranking and not just top/bottom 5?