

People talk a lot about student debt and the burden it places on recent graduates. Not surprisingly, different countries come to different policy conclusions about how this burden should be dealt with. Today’s column examines how various countries choose to deal with this issue.
What I am going to do today is compare expected loan repayments under five different student loan regimes: Canada, the US, the UK, Australian and New Zealand. This obviously does not fully examine the issue of loan “burdens” – to do that properly would require information on average debt and average post-graduate income which I suppose I could find but can’t be bothered to do just at the moment. But it’s still a revealing exercise.
First, a brief description of the loan repayment schemes. Canada and the Unites States have very similar systems, in that they are technically “mortgage-style” loan systems (you pay them down as you would a home mortgage, in equal installments), but which have “income-sensitive” features to help lower-income borrowers. In Canada, that means the Repayment Assistance Program (RAP), which requires no repayment if income is below $25,000 and restricts payments to a maximum of 20% of income over that threshold. In the US it is called PAYE (Pay-As-You-Earn) or REPAYE (don’t ask), which requires no payment if “adjusted gross income” (meaning income minus certain allowable deductions, roughly equivalent to line 260 on a Canadian tax form,) is less than 150% of the poverty line, which in practice means US$17,820 for a single individual. Repayments are restricted to 10% of income above that level. In both countries what that means is that repayment is directly tied to income until the point where payments rise above what they would be on a mortgage-style arrangement, at which point borrowers switch into the mortgage system.
The other three systems are income-contingent, meaning repayment is geared exclusively to income regardless of the size of the outstanding debt. In the UK, the repayment threshold is £21,000 and borrowers repay 9% of their income above this level. In New Zealand, the repayment threshold is NZ$19,084, and borrowers repay 12% of their income above this level. Australia is more complicated: borrowers pay nothing until income passes $54,869, but then one pays an escalating percentage, starting at 4%, of one’s entire income (not just the bit above the threshold) as income rises above this. For those interested, the contributions table is here.
For this comparison, I assume that the Canadian and American subjects each have outstanding loans of $25,000 (in local currency) which are eligible for income-based repayment. As noted above, size of debt is irrelevant for the other three examples. I have converted everything into Canadian dollars at purchasing power parity using the July 2016 Big Mac Index (C$1=NZ$1=A$.958=$US.84=£.496).
With all that out of the way, Figure 1 shows how much student loan borrowers are expected to repay per month under each of the five systems.
Figure 1: Required Monthly Repayment on Student Loans, by Income Level, in C$ at PPP, Selected Countries
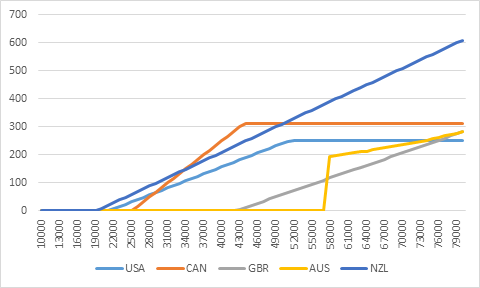
The essential natures of each country’s program can be seen in this graph. Canada and the US start out as upwardly-sloping lines but then plateau, which reflects their common nature as a blend of income-based and mortgage-style lending. Payments in the US system rise more gently because of the different repayment maximum (10% vs 20%) and plateau at a lower level because of lower interest rates. The New Zealand and UK patterns are simple upwardly-sloping curves. Australia’s curve is notable not just because it is at zero for a long period but also because it jumps quickly at the point of the threshold. In the social science literature, this is what they call a “step-function”, and it’s not a great idea because it means at the point of the threshold, individuals actually become significantly worse off (in this case, by $193 per month) by earning one extra dollar.
At low levels of borrower income, Canada, the United States and New Zealand all look quite similar in that they require borrowers to begin repayment at much lower levels of income ($20-25,000) than in either the UK ($43,000) or Australia ($57,000). At income levels between $20,000 and $34,000, New Zealand demands the highest levels of repayment. Between $34,000 and $50,000 (the part of the income curve where most recent graduates can be found), Canada has the highest repayment requirements; above $50,000 it’s New Zealand again. Between $25,000 and $75,000 it is definitely advantageous to be in Australia or the UK as these have the lowest payments. However, by $80,000 repayments in the US system are the lowest and if we were to extend the chart out to $85,000 then we would see repayments in Australia and the UK exceed the Canadian level.
A final point: the Canadian system imposes the highest costs on students in precisely the income-range where most recent graduates fall. We could do more for them here; specifically, if we reduced the maximum repayment rate to 15% from 20%, we would kink the curve in such a way that monthly repayments would never be higher than they are in New Zealand. Something to think about for the next budget, perhaps.
 Tweet this post

Although the ‘step-function’ in Australian repayments certainly causes some issues (we can see it in the tax data, as people artificially hold their taxable incomes down) it has one major advantage: that people consistently earning at or just above the threshold will fully repay in Australia as they repay more than $2000 a year, while in other countries 9% or 12% of small margins above the threshold will lead to at best very slow repayment, and more likely some debt never being repaid.